
- Startseite >
- Flüsse >
- Schwebstoff >
- Obere Donau >
- Ingolstadt Luitpoldstraße >
- Jahresgrafik

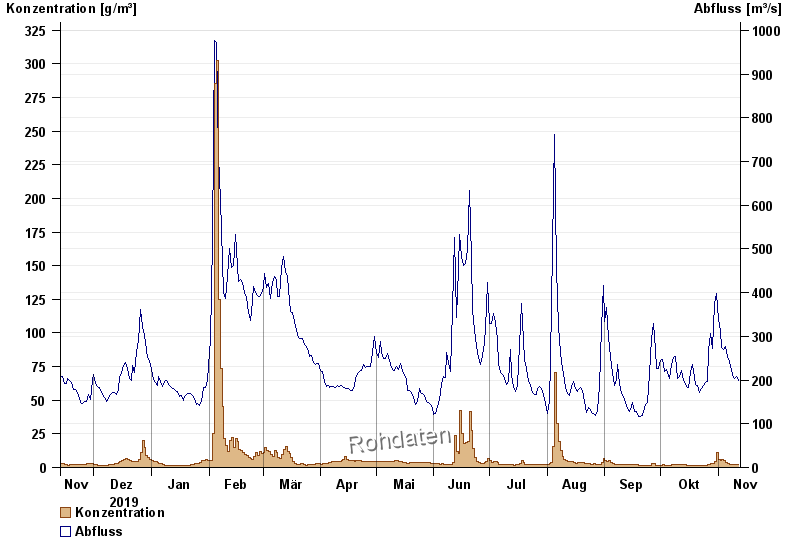
Jahresgrafik Ingolstadt Luitpoldstraße / Donau
Schwebstoff vom 13.11.2019 bis zum 12.11.2020
| Datum | Konzentration [g/m³] | Abfluss [m³/s] |
|---|---|---|
| 12.11.2020 | 2,4 | 199 |
| 11.11.2020 | 2,2 | 209 |
| 10.11.2020 | 2,1 | 203 |
| 09.11.2020 | 2,0 | 205 |
| 08.11.2020 | 2,3 | 222 |
| 07.11.2020 | 2,4 | 243 |
| 06.11.2020 | 2,8 | 254 |
© Bayerisches Landesamt für Umwelt 2024