
- Startseite >
- Flüsse >
- Schwebstoff >
- Obere Donau >
- Ingolstadt Luitpoldstraße >
- Jahresgrafik

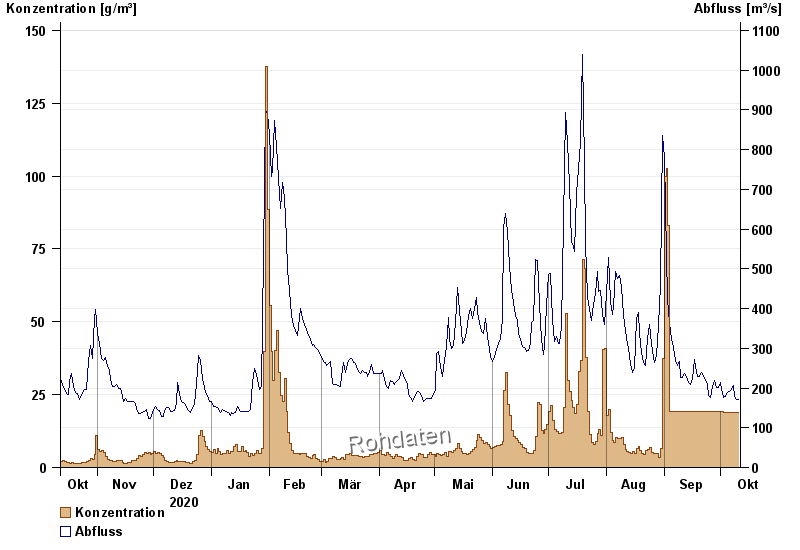
Jahresgrafik Ingolstadt Luitpoldstraße / Donau
Schwebstoff vom 12.10.2020 bis zum 11.10.2021
| Datum | Konzentration [g/m³] | Abfluss [m³/s] |
|---|---|---|
| 11.10.2021 | 18,8 | 171 |
| 10.10.2021 | 18,9 | 171 |
| 09.10.2021 | 18,9 | 179 |
| 08.10.2021 | 18,9 | 206 |
| 07.10.2021 | 18,9 | 197 |
| 06.10.2021 | 18,9 | 192 |
| 05.10.2021 | 18,9 | 189 |
© Bayerisches Landesamt für Umwelt 2024