
- Startseite >
- Flüsse >
- Schwebstoff >
- Obere Donau >
- Ingolstadt Luitpoldstraße >
- Jahresgrafik

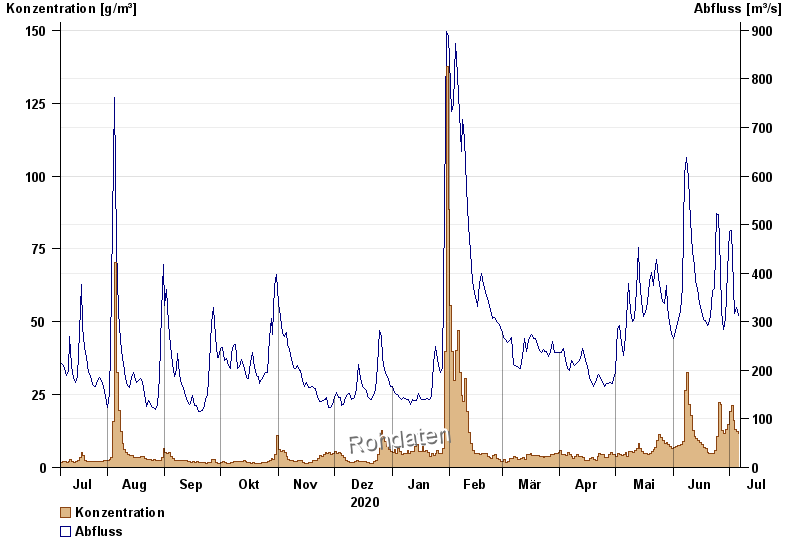
Jahresgrafik Ingolstadt Luitpoldstraße / Donau
Schwebstoff vom 07.07.2020 bis zum 06.07.2021
| Datum | Konzentration [g/m³] | Abfluss [m³/s] |
|---|---|---|
| 06.07.2021 | 11,5 | 313 |
| 05.07.2021 | 12,2 | 329 |
| 04.07.2021 | 12,9 | 318 |
| 03.07.2021 | 16,2 | 373 |
| 02.07.2021 | 21,3 | 487 |
| 01.07.2021 | 19,3 | 485 |
| 30.06.2021 | 14,7 | 404 |
© Bayerisches Landesamt für Umwelt 2024