
- Startseite >
- Flüsse >
- Schwebstoff >
- Obere Donau >
- Ingolstadt Luitpoldstraße >
- Jahresgrafik

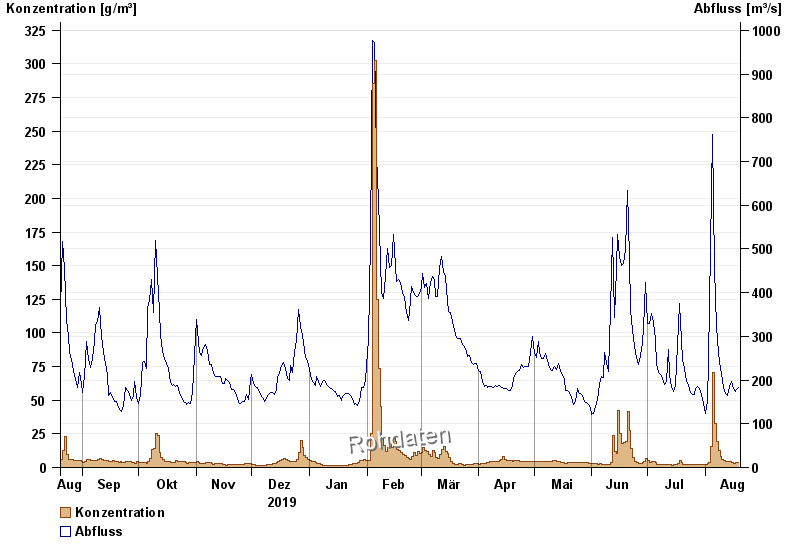
Jahresgrafik Ingolstadt Luitpoldstraße / Donau
Schwebstoff vom 20.08.2019 bis zum 19.08.2020
| Datum | Konzentration [g/m³] | Abfluss [m³/s] |
|---|---|---|
| 19.08.2020 | 3,8 | 183 |
| 18.08.2020 | 3,5 | 179 |
| 17.08.2020 | 3,4 | 174 |
| 16.08.2020 | 3,3 | 181 |
| 15.08.2020 | 3,6 | 196 |
| 14.08.2020 | 4,1 | 185 |
| 13.08.2020 | 4,2 | 164 |
© Bayerisches Landesamt für Umwelt 2024