
- Startseite >
- Flüsse >
- Schwebstoff >
- Obere Donau >
- Donauwörth >
- Monatsgrafik

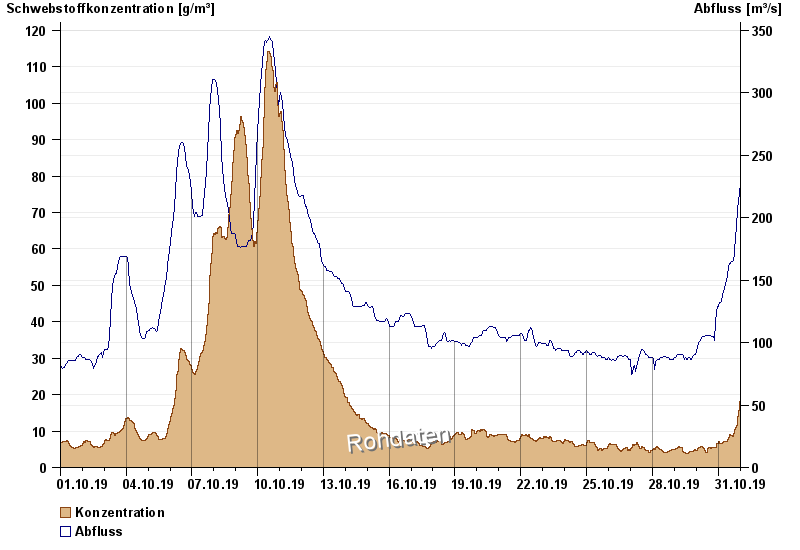
Monatsgrafik Donauwörth / Donau
Schwebstoff vom 01.10.2019 bis zum 31.10.2019
| Datum | Konzentration [g/m³] | Abfluss [m³/s] |
|---|---|---|
| 31.10.2019 23:45 | 18,8 | 226 |
| 31.10.2019 23:30 | 18,4 | 224 |
| 31.10.2019 23:15 | 18,1 | 221 |
| 31.10.2019 23:00 | 17,8 | 218 |
| 31.10.2019 22:45 | 16,6 | 214 |
| 31.10.2019 22:30 | 15,8 | 211 |
| 31.10.2019 22:15 | 15,4 | 207 |
© Bayerisches Landesamt für Umwelt 2024