
- Startseite >
- Flüsse >
- Schwebstoff >
- Obere Donau >
- Donauwörth >
- Jahresgrafik

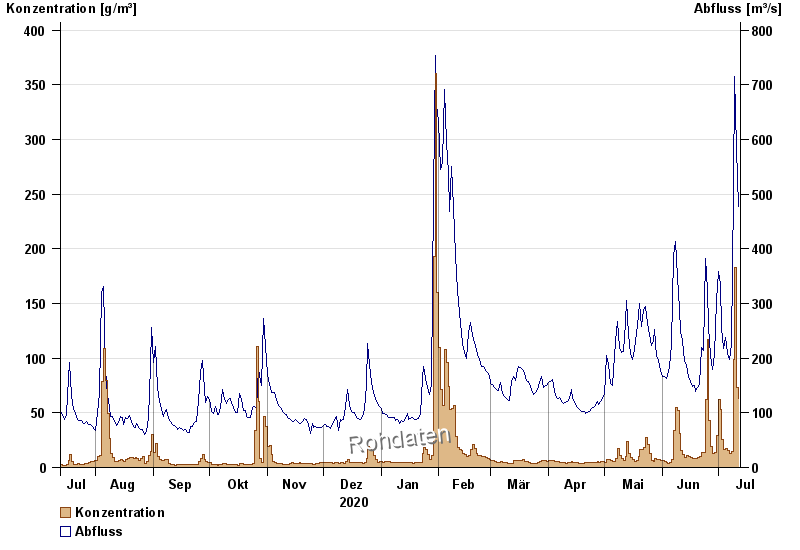
Jahresgrafik Donauwörth / Donau
Schwebstoff vom 13.07.2020 bis zum 12.07.2021
| Datum | Konzentration [g/m³] | Abfluss [m³/s] |
|---|---|---|
| 12.07.2021 | 63,1 | 478 |
| 11.07.2021 | 72,8 | 584 |
| 10.07.2021 | 183,2 | 716 |
| 09.07.2021 | 98,8 | 503 |
| 08.07.2021 | 15,1 | 225 |
| 07.07.2021 | 12,6 | 197 |
| 06.07.2021 | 15,3 | 209 |
© Bayerisches Landesamt für Umwelt 2024