
- Startseite >
- Flüsse >
- Schwebstoff >
- Obere Donau >
- Behringersmühle >
- Jahresgrafik

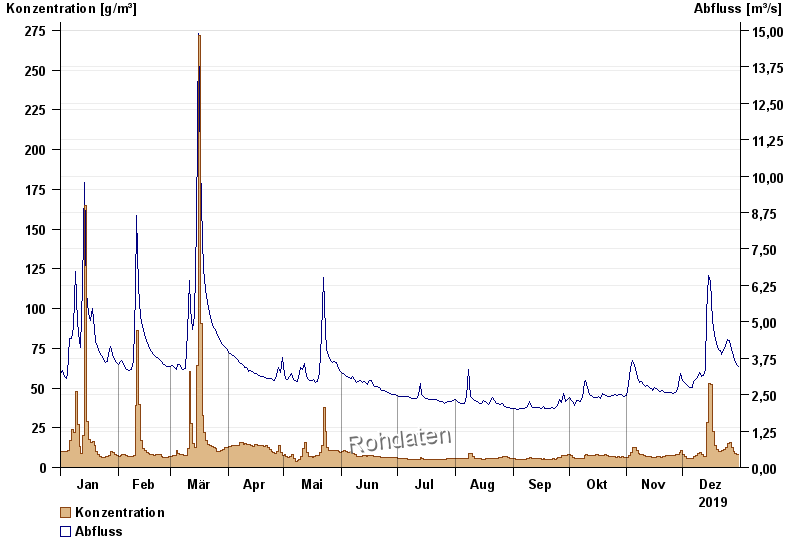
Jahresgrafik Behringersmühle / Wiesent
Schwebstoff vom 01.01.2019 bis zum 31.12.2019
| Datum | Konzentration [g/m³] | Abfluss [m³/s] |
|---|---|---|
| 31.12.2019 | 7,9 | 3,46 |
| 30.12.2019 | 8,2 | 3,54 |
| 29.12.2019 | 8,9 | 3,68 |
| 28.12.2019 | 10,3 | 3,83 |
| 27.12.2019 | 12,6 | 4,04 |
| 26.12.2019 | 15,6 | 4,36 |
| 25.12.2019 | 15,2 | 4,39 |
© Bayerisches Landesamt für Umwelt 2024