
- Startseite >
- Flüsse >
- Schwebstoff >
- Isar >
- Weilheim >
- Monatsgrafik

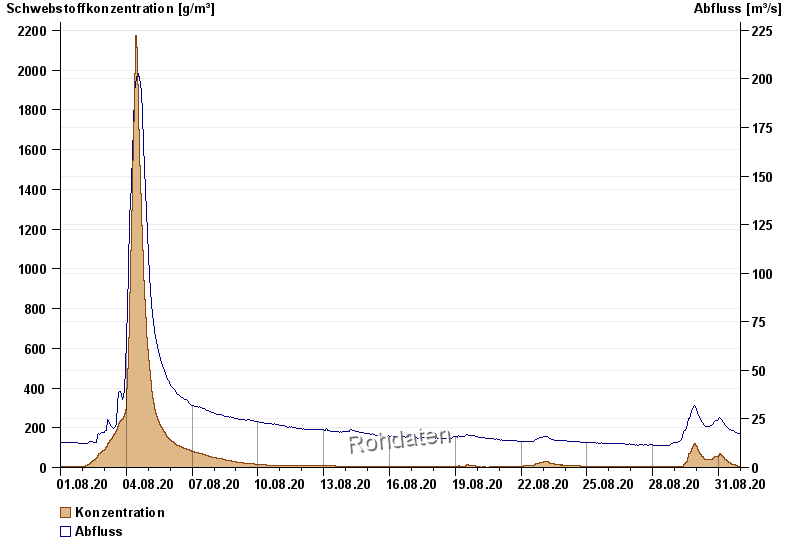
Monatsgrafik Weilheim / Ammer
Schwebstoff vom 01.08.2020 bis zum 31.08.2020
Beeinflussung
Moegliche Beeinflussung durch Bauarbeiten im oder am Gewaesser! Das Bauende ist offen.
| Datum | Konzentration [g/m³] | Abfluss [m³/s] |
|---|---|---|
| 31.08.2020 23:45 | 3,5 | 17,5 |
| 31.08.2020 23:30 | 3,6 | 17,1 |
| 31.08.2020 23:15 | 3,6 | 17,1 |
| 31.08.2020 23:00 | 3,6 | 17,1 |
| 31.08.2020 22:45 | 3,6 | 17,1 |
| 31.08.2020 22:30 | 3,6 | 17,1 |
| 31.08.2020 22:15 | 7,0 | 17,5 |
© Bayerisches Landesamt für Umwelt 2024