
- Startseite >
- Flüsse >
- Schwebstoff >
- Isar >
- Staudach >
- Monatsgrafik

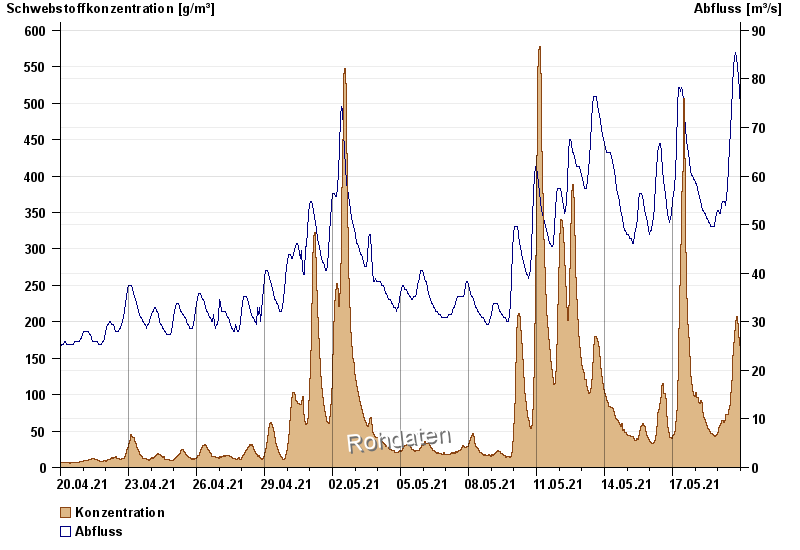
Monatsgrafik Staudach / Tiroler Achen
Schwebstoff vom 20.04.2021 bis zum 19.05.2021
| Datum | Konzentration [g/m³] | Abfluss [m³/s] |
|---|---|---|
| 19.05.2021 23:45 | 118,2 | 73,4 |
| 19.05.2021 23:30 | 121,6 | 73,4 |
| 19.05.2021 23:15 | 126,8 | 74,4 |
| 19.05.2021 23:00 | 131,2 | 74,4 |
| 19.05.2021 22:45 | 133,4 | 74,4 |
| 19.05.2021 22:30 | 138,8 | 74,4 |
| 19.05.2021 22:15 | 144,0 | 75,3 |
© Bayerisches Landesamt für Umwelt 2024