
- Startseite >
- Flüsse >
- Schwebstoff >
- Isar >
- Staudach >
- Jahresgrafik

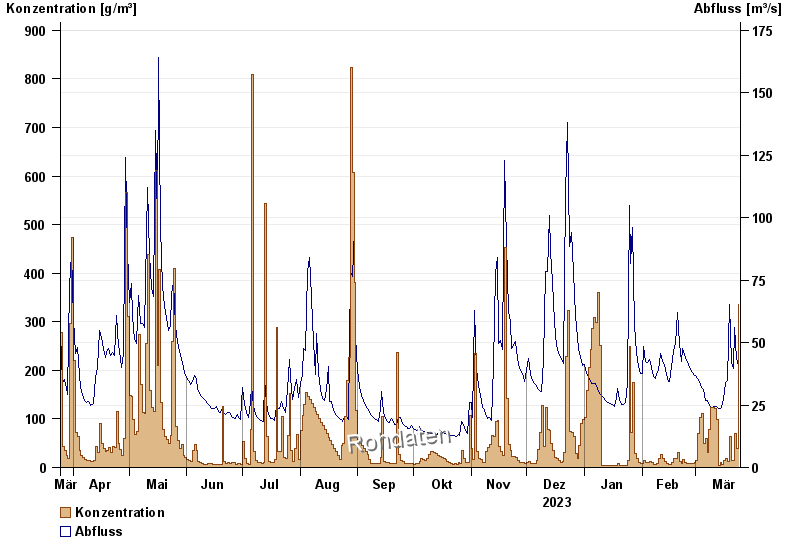
Jahresgrafik Staudach / Tiroler Achen
Schwebstoff vom 25.03.2023 bis zum 24.03.2024
| Datum | Konzentration [g/m³] | Abfluss [m³/s] |
|---|---|---|
| 24.03.2024 | 335,6 | 41 |
| 23.03.2024 | 38,2 | 43,6 |
| 22.03.2024 | 69,7 | 56,2 |
| 21.03.2024 | 15,0 | 39,8 |
| 20.03.2024 | 15,4 | 41,9 |
| 19.03.2024 | 63,5 | 65,2 |
| 18.03.2024 | 12,7 | 34,7 |
© Bayerisches Landesamt für Umwelt 2024