
- Startseite >
- Flüsse >
- Schwebstoff >
- Isar >
- Plattling >
- Monatsgrafik

Monatsgrafik Plattling / Isar
Schwebstoff vom 14.06.2021 bis zum 13.07.2021
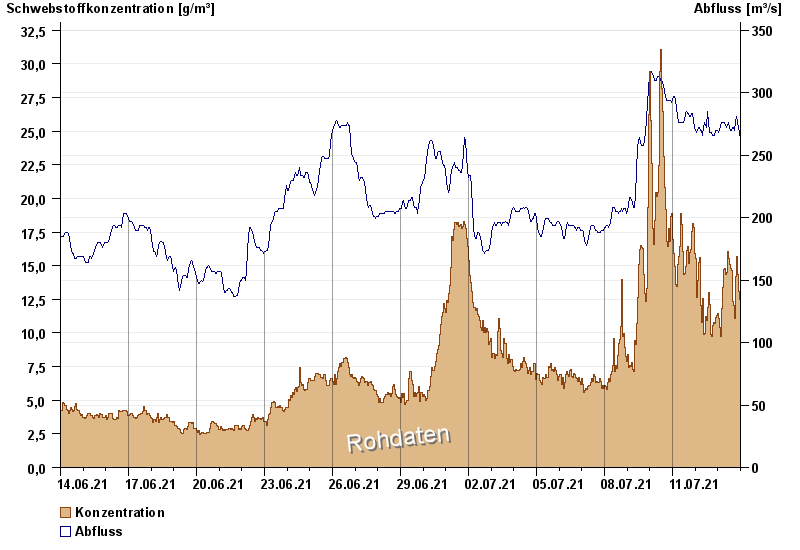
| Datum | Konzentration [g/m³] | Abfluss [m³/s] |
|---|---|---|
| 13.07.2021 23:45 | 9,0 | 253 |
| 13.07.2021 23:30 | 9,1 | 255 |
| 13.07.2021 23:15 | 9,2 | 255 |
| 13.07.2021 23:00 | 9,5 | 258 |
| 13.07.2021 22:45 | 10,1 | 260 |
| 13.07.2021 22:30 | 10,6 | 262 |
| 13.07.2021 22:15 | 10,8 | 262 |
© Bayerisches Landesamt für Umwelt 2024