
- Startseite >
- Flüsse >
- Schwebstoff >
- Isar >
- Plattling >
- Monatsgrafik

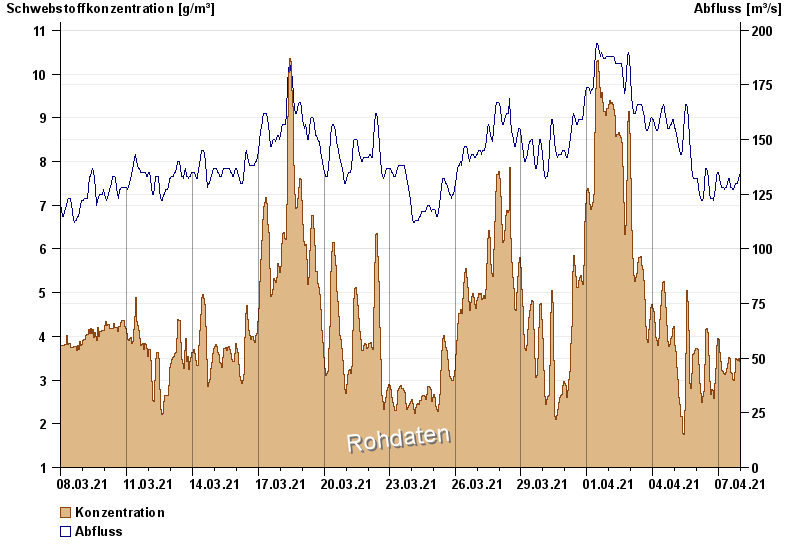
Monatsgrafik Plattling / Isar
Schwebstoff vom 08.03.2021 bis zum 07.04.2021
| Datum | Konzentration [g/m³] | Abfluss [m³/s] |
|---|---|---|
| 07.04.2021 23:45 | 3,3 | 135 |
| 07.04.2021 23:30 | 3,4 | 135 |
| 07.04.2021 23:15 | 3,3 | 135 |
| 07.04.2021 23:00 | 3,5 | 135 |
| 07.04.2021 22:45 | 3,3 | 135 |
| 07.04.2021 22:30 | 3,3 | 135 |
| 07.04.2021 22:15 | 3,4 | 133 |
© Bayerisches Landesamt für Umwelt 2024