
- Startseite >
- Flüsse >
- Schwebstoff >
- Isar >
- Plattling >
- Monatsgrafik

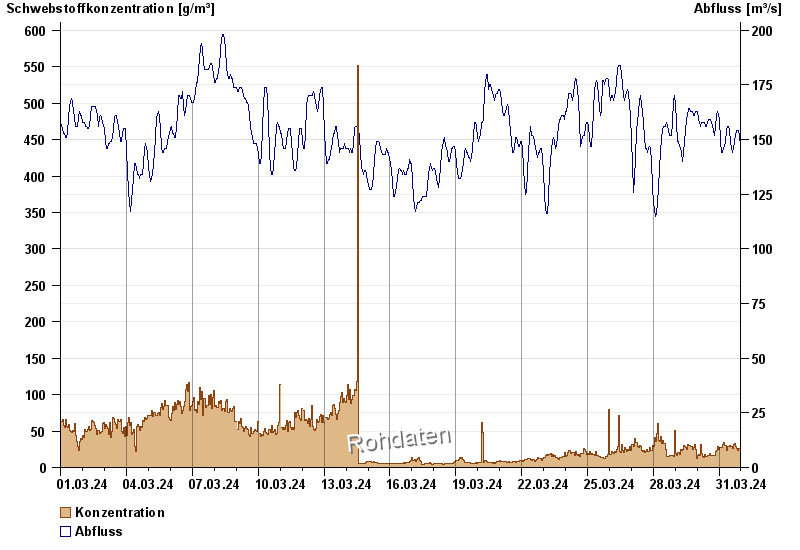
Monatsgrafik Plattling / Isar
Schwebstoff vom 01.03.2024 bis zum 31.03.2024
| Datum | Konzentration [g/m³] | Abfluss [m³/s] |
|---|---|---|
| 31.03.2024 23:45 | 27,8 | 139 |
| 31.03.2024 23:30 | 20,3 | 140 |
| 31.03.2024 23:15 | 18,4 | 142 |
| 31.03.2024 23:00 | 20,3 | 144 |
| 31.03.2024 22:45 | 17,7 | 146 |
| 31.03.2024 22:30 | 18,8 | 147 |
| 31.03.2024 22:15 | 26,0 | 149 |
© Bayerisches Landesamt für Umwelt 2024