
- Startseite >
- Flüsse >
- Schwebstoff >
- Isar >
- Plattling >
- Jahresgrafik

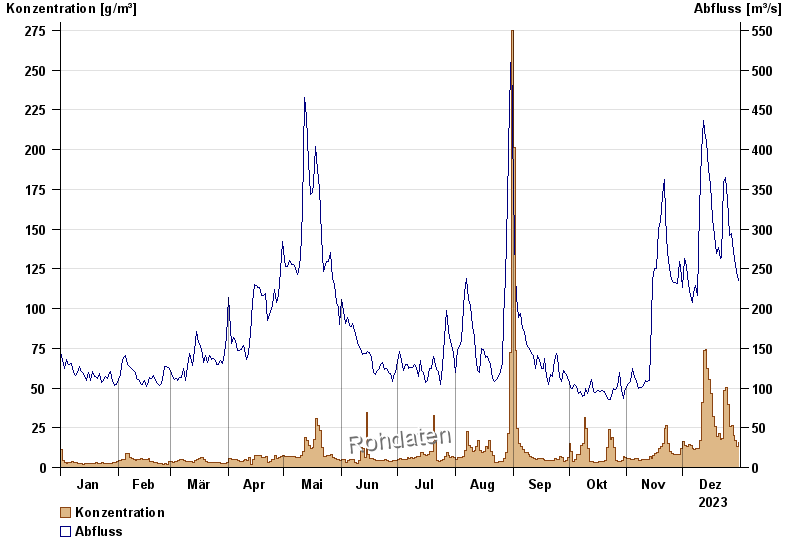
Jahresgrafik Plattling / Isar
Schwebstoff vom 01.01.2023 bis zum 31.12.2023
| Datum | Konzentration [g/m³] | Abfluss [m³/s] |
|---|---|---|
| 31.12.2023 | 9,3 | 235 |
| 30.12.2023 | 10,8 | 246 |
| 29.12.2023 | 13,0 | 262 |
| 28.12.2023 | 18,3 | 272 |
| 27.12.2023 | 27,5 | 294 |
| 26.12.2023 | 28,9 | 292 |
| 25.12.2023 | 44,2 | 337 |
© Bayerisches Landesamt für Umwelt 2025