
- Startseite >
- Flüsse >
- Schwebstoff >
- Isar >
- Plattling >
- Jahresgrafik

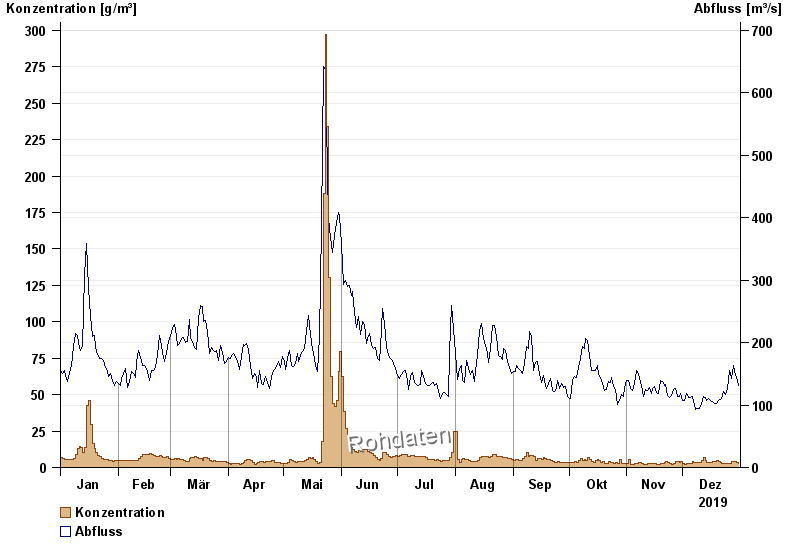
Jahresgrafik Plattling / Isar
Schwebstoff vom 01.01.2019 bis zum 31.12.2019
| Datum | Konzentration [g/m³] | Abfluss [m³/s] |
|---|---|---|
| 31.12.2019 | 2,6 | 131 |
| 30.12.2019 | 3,4 | 144 |
| 29.12.2019 | 4,4 | 153 |
| 28.12.2019 | 3,8 | 163 |
| 27.12.2019 | 4,1 | 143 |
| 26.12.2019 | 3,1 | 156 |
| 25.12.2019 | 2,5 | 127 |
© Bayerisches Landesamt für Umwelt 2024