
- Startseite >
- Flüsse >
- Schwebstoff >
- Isar >
- Passau Marienbrücke >
- Jahresgrafik

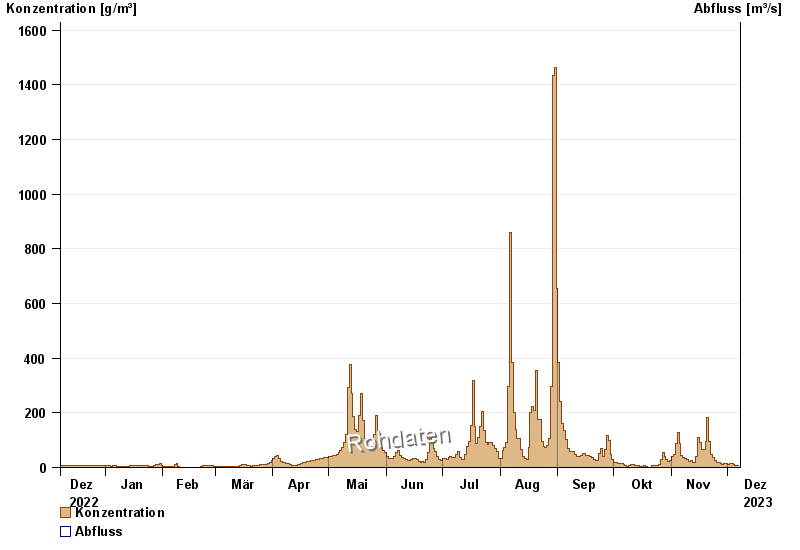
Jahresgrafik Passau Marienbrücke / Inn
Schwebstoff vom 08.12.2022 bis zum 07.12.2023
| Datum | Konzentration [g/m³] | Abfluss [m³/s] |
|---|---|---|
| 07.12.2023 | 8,2 | -- |
| 06.12.2023 | 7,5 | -- |
| 05.12.2023 | 8,5 | -- |
| 04.12.2023 | 11,4 | -- |
| 03.12.2023 | 12,9 | -- |
| 02.12.2023 | 12,9 | -- |
| 01.12.2023 | 11,7 | -- |
© Bayerisches Landesamt für Umwelt 2024