
- Startseite >
- Flüsse >
- Schwebstoff >
- Isar >
- Kochel >
- Jahresgrafik

Jahresgrafik Kochel / Loisach
Schwebstoff vom 01.01.2019 bis zum 31.12.2019
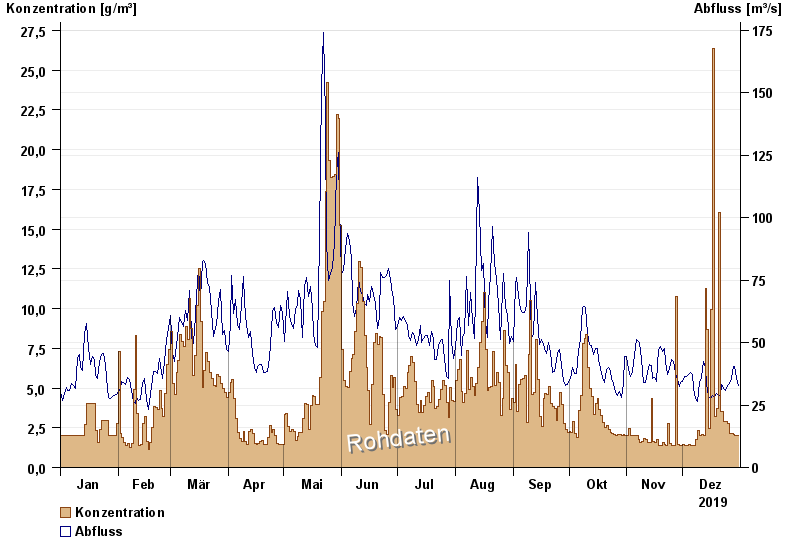
| Datum | Konzentration [g/m³] | Abfluss [m³/s] |
|---|---|---|
| 31.12.2019 | 2,0 | 32,7 |
| 30.12.2019 | 2,0 | 35,8 |
| 29.12.2019 | 2,0 | 40,3 |
| 28.12.2019 | 2,1 | 40,3 |
| 27.12.2019 | 2,2 | 35,5 |
| 26.12.2019 | 2,1 | 33,7 |
| 25.12.2019 | 2,8 | 33 |
© Bayerisches Landesamt für Umwelt 2024