
- Startseite >
- Flüsse >
- Schwebstoff >
- Isar >
- Ingolstadt Luitpoldstraße >
- Jahresgrafik

Jahresgrafik Ingolstadt Luitpoldstraße / Donau
Schwebstoff vom 11.05.2022 bis zum 10.05.2023
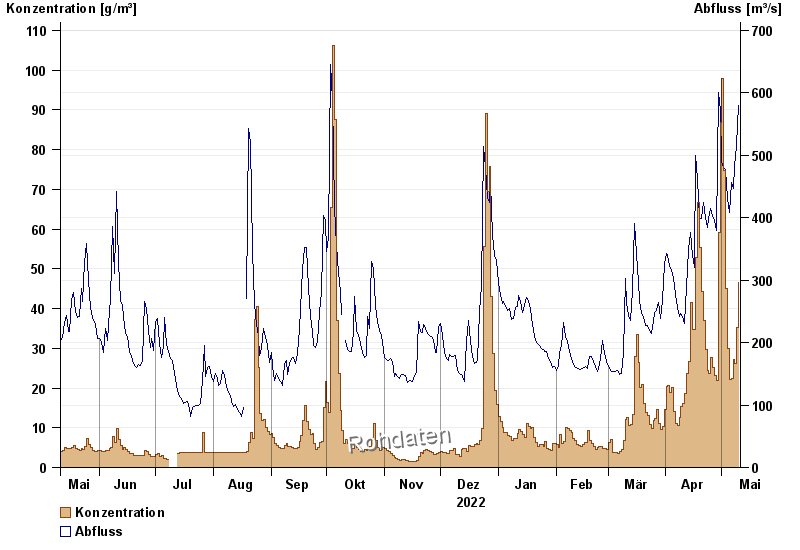
| Datum | Konzentration [g/m³] | Abfluss [m³/s] |
|---|---|---|
| 10.05.2023 | 46,4 | 580 |
| 09.05.2023 | 35,1 | 515 |
| 08.05.2023 | 26,2 | 482 |
| 07.05.2023 | 27,2 | 446 |
| 06.05.2023 | 22,3 | 456 |
| 05.05.2023 | 22,1 | 409 |
| 04.05.2023 | 29,8 | 431 |
© Bayerisches Landesamt für Umwelt 2024