
- Startseite >
- Flüsse >
- Schwebstoff >
- Isar >
- Ingolstadt Luitpoldstraße >
- Jahresgrafik

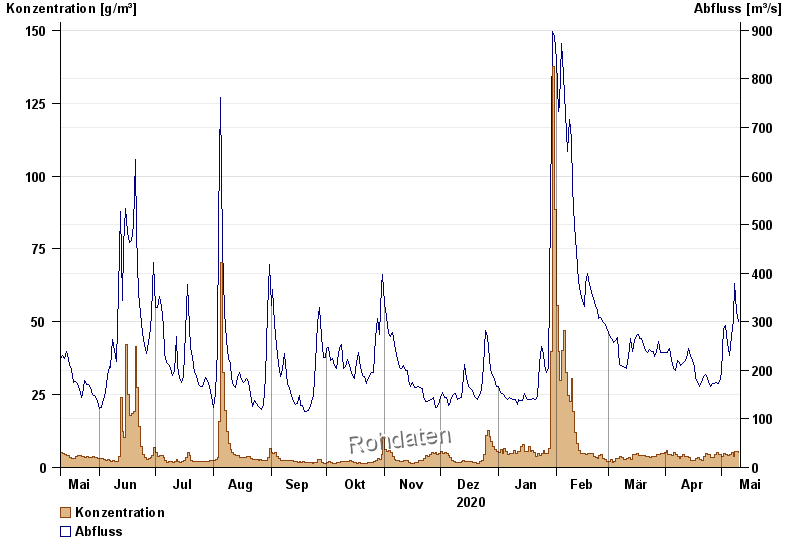
Jahresgrafik Ingolstadt Luitpoldstraße / Donau
Schwebstoff vom 11.05.2020 bis zum 10.05.2021
| Datum | Konzentration [g/m³] | Abfluss [m³/s] |
|---|---|---|
| 10.05.2021 | 5,0 | 300 |
| 09.05.2021 | 5,7 | 322 |
| 08.05.2021 | 5,6 | 378 |
| 07.05.2021 | 3,9 | 304 |
| 06.05.2021 | 5,3 | 270 |
| 05.05.2021 | 4,4 | 230 |
| 04.05.2021 | 3,9 | 255 |
© Bayerisches Landesamt für Umwelt 2024