
- Startseite >
- Flüsse >
- Schwebstoff >
- Inn >
- Unterjettenberg >
- Jahresgrafik

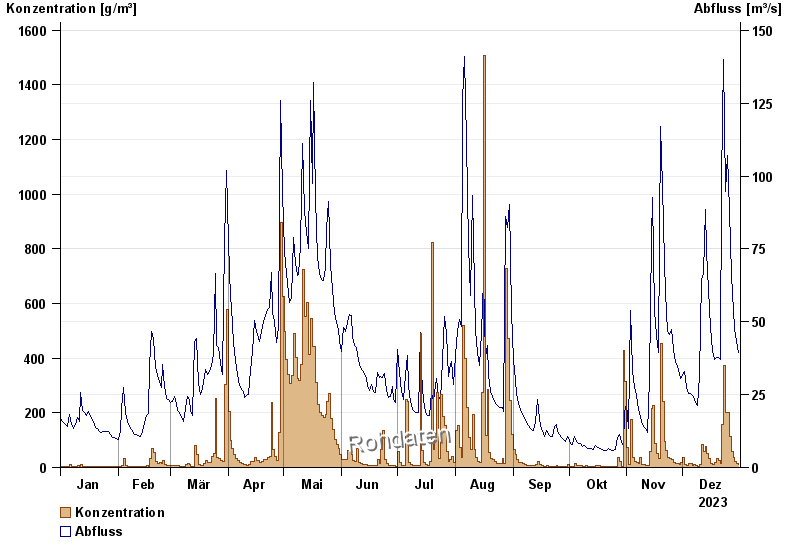
Jahresgrafik Unterjettenberg / Saalach
Schwebstoff vom 01.01.2023 bis zum 31.12.2023
| Datum | Konzentration [g/m³] | Abfluss [m³/s] |
|---|---|---|
| 31.12.2023 | 11,9 | 39,4 |
| 30.12.2023 | 15,8 | 43,1 |
| 29.12.2023 | 22,5 | 47,8 |
| 28.12.2023 | 37,4 | 54 |
| 27.12.2023 | 58,0 | 65,8 |
| 26.12.2023 | 112,2 | 88,2 |
| 25.12.2023 | 200,1 | 107 |
© Bayerisches Landesamt für Umwelt 2024