
- Startseite >
- Flüsse >
- Schwebstoff >
- Inn >
- Staudach >
- Monatsgrafik

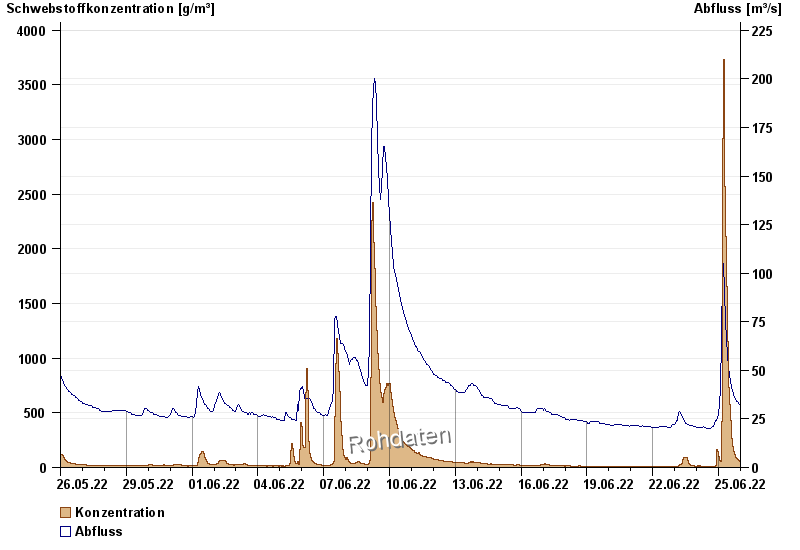
Monatsgrafik Staudach / Tiroler Achen
Schwebstoff vom 26.05.2022 bis zum 25.06.2022
| Datum | Konzentration [g/m³] | Abfluss [m³/s] |
|---|---|---|
| 25.06.2022 23:45 | 47,4 | 30,8 |
| 25.06.2022 23:30 | 48,6 | 30,8 |
| 25.06.2022 23:15 | 50,4 | 31,5 |
| 25.06.2022 23:00 | 51,7 | 30,8 |
| 25.06.2022 22:45 | 51,4 | 30,8 |
| 25.06.2022 22:30 | 52,4 | 31,5 |
| 25.06.2022 22:15 | 54,6 | 31,5 |
© Bayerisches Landesamt für Umwelt 2024