
- Startseite >
- Flüsse >
- Schwebstoff >
- Inn >
- Staudach >
- Monatsgrafik

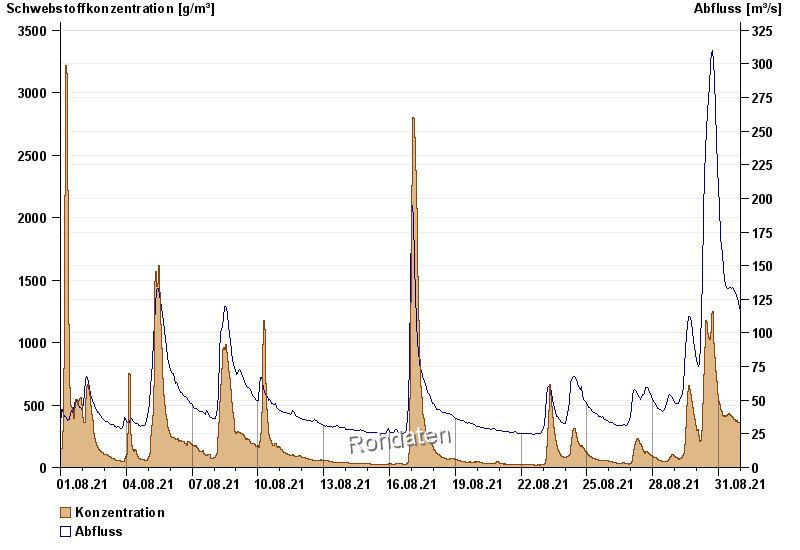
Monatsgrafik Staudach / Tiroler Achen
Schwebstoff vom 01.08.2021 bis zum 31.08.2021
| Datum | Konzentration [g/m³] | Abfluss [m³/s] |
|---|---|---|
| 31.08.2021 23:45 | 340,1 | 112 |
| 31.08.2021 23:30 | 343,1 | 113 |
| 31.08.2021 23:15 | 345,9 | 114 |
| 31.08.2021 23:00 | 342,2 | 114 |
| 31.08.2021 22:45 | 341,3 | 115 |
| 31.08.2021 22:30 | 344,4 | 117 |
| 31.08.2021 22:15 | 346,8 | 117 |
© Bayerisches Landesamt für Umwelt 2024