
- Startseite >
- Flüsse >
- Schwebstoff >
- Inn >
- Staudach >
- Jahresgrafik

Jahresgrafik Staudach / Tiroler Achen
Schwebstoff vom 24.07.2020 bis zum 23.07.2021
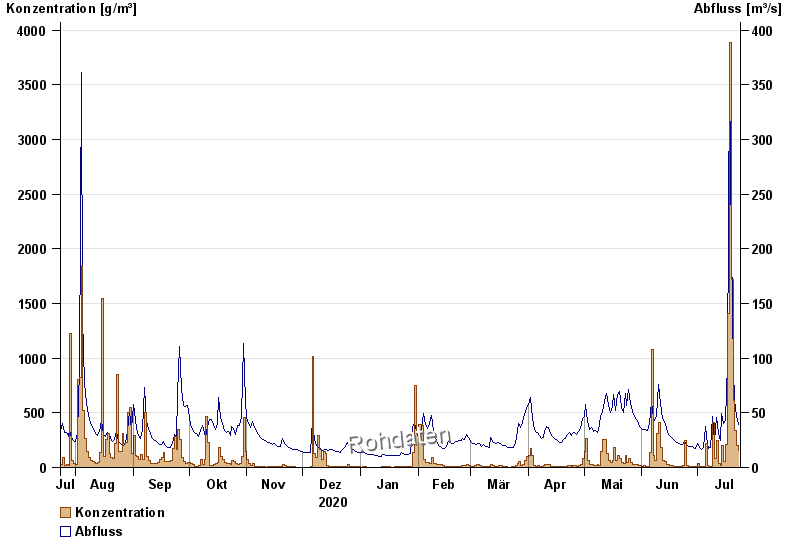
| Datum | Konzentration [g/m³] | Abfluss [m³/s] |
|---|---|---|
| 23.07.2021 | 155,6 | 39,4 |
| 22.07.2021 | 203,1 | 48 |
| 21.07.2021 | 334,1 | 61,4 |
| 20.07.2021 | 613,8 | 89,6 |
| 19.07.2021 | 1720,3 | 202 |
| 18.07.2021 | 3891,7 | 355 |
| 17.07.2021 | 1405,1 | 94,5 |
© Bayerisches Landesamt für Umwelt 2024