
- Startseite >
- Flüsse >
- Schwebstoff >
- Inn >
- Staudach >
- Jahresgrafik

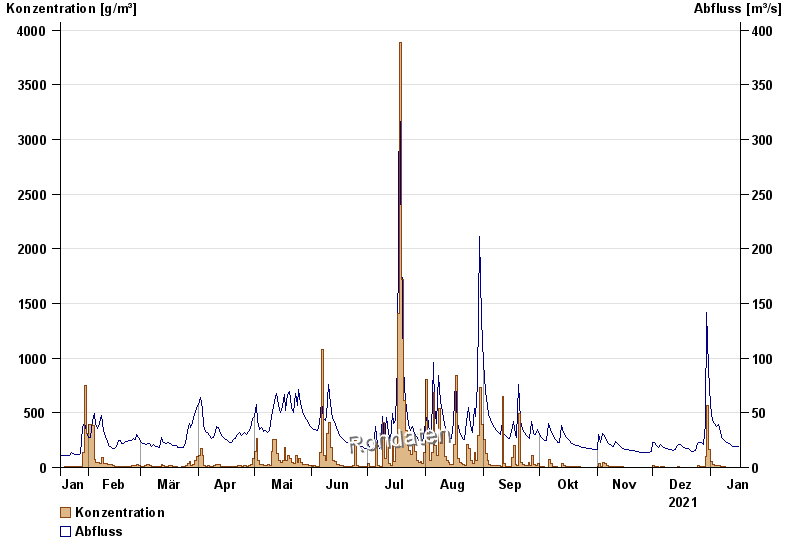
Jahresgrafik Staudach / Tiroler Achen
Schwebstoff vom 17.01.2021 bis zum 16.01.2022
| Datum | Konzentration [g/m³] | Abfluss [m³/s] |
|---|---|---|
| 16.01.2022 | 2,7 | 18,8 |
| 15.01.2022 | 2,7 | 19,3 |
| 14.01.2022 | 2,8 | 19,3 |
| 13.01.2022 | 2,8 | 19,4 |
| 12.01.2022 | 3,1 | 20,2 |
| 11.01.2022 | 3,5 | 21,8 |
| 10.01.2022 | 3,3 | 22,9 |
© Bayerisches Landesamt für Umwelt 2024