
- Startseite >
- Flüsse >
- Schwebstoff >
- Inn >
- Staudach >
- Jahresgrafik

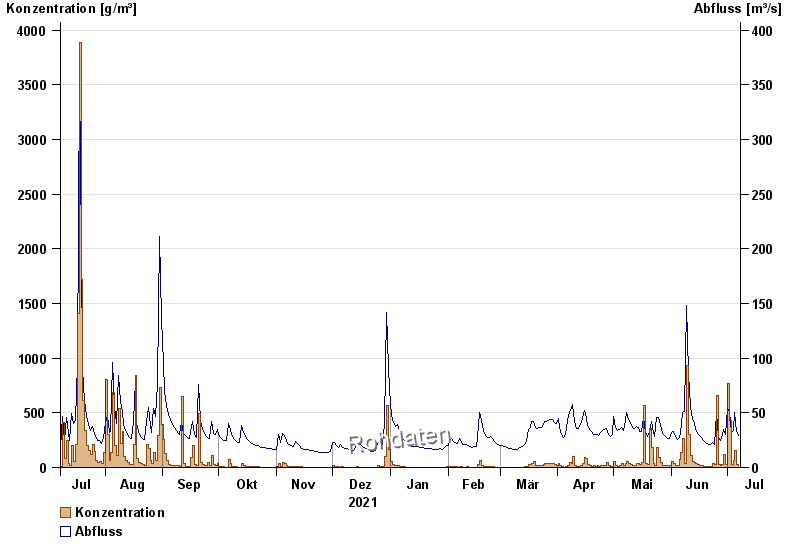
Jahresgrafik Staudach / Tiroler Achen
Schwebstoff vom 08.07.2021 bis zum 07.07.2022
| Datum | Konzentration [g/m³] | Abfluss [m³/s] |
|---|---|---|
| 07.07.2022 | 18,3 | 29,3 |
| 06.07.2022 | 27,1 | 32,7 |
| 05.07.2022 | 157,0 | 50,2 |
| 04.07.2022 | 67,3 | 33,7 |
| 03.07.2022 | 27,0 | 32,3 |
| 02.07.2022 | 427,0 | 51 |
| 01.07.2022 | 764,0 | 53,6 |
© Bayerisches Landesamt für Umwelt 2024