
- Startseite >
- Flüsse >
- Schwebstoff >
- Inn >
- Staudach >
- Jahresgrafik

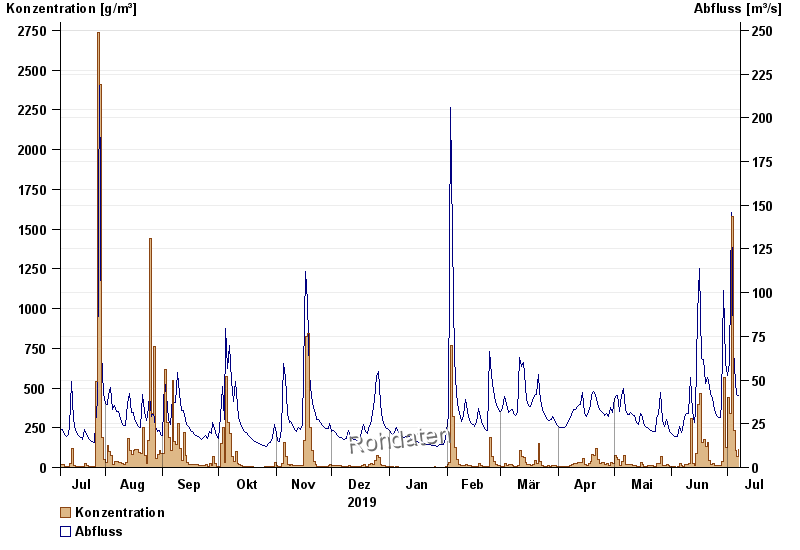
Jahresgrafik Staudach / Tiroler Achen
Schwebstoff vom 08.07.2019 bis zum 07.07.2020
| Datum | Konzentration [g/m³] | Abfluss [m³/s] |
|---|---|---|
| 07.07.2020 | 115,4 | 41,4 |
| 06.07.2020 | 68,3 | 41,7 |
| 05.07.2020 | 108,9 | 48,8 |
| 04.07.2020 | 229,7 | 66,7 |
| 03.07.2020 | 1578,9 | 146 |
| 02.07.2020 | 338,5 | 59,8 |
| 01.07.2020 | 441,7 | 52,6 |
© Bayerisches Landesamt für Umwelt 2024