
- Startseite >
- Flüsse >
- Schwebstoff >
- Inn >
- Mittenwald >
- Jahresgrafik

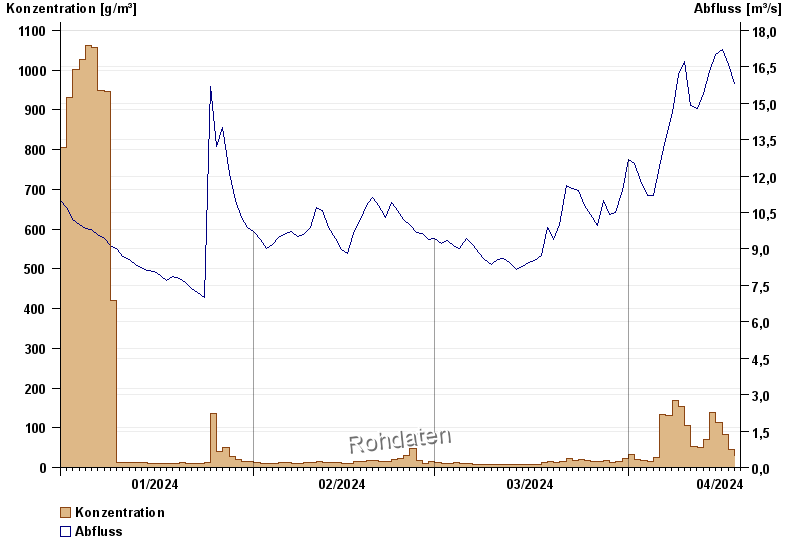
Jahresgrafik Mittenwald / Isar
Schwebstoff vom 01.01.2024 bis zum 18.04.2024
| Datum | Konzentration [g/m³] | Abfluss [m³/s] |
|---|---|---|
| 18.04.2024 | 30,5 | 15,8 |
| 17.04.2024 | 46,1 | 16,6 |
| 16.04.2024 | 81,8 | 17,2 |
| 15.04.2024 | 114,2 | 17 |
| 14.04.2024 | 137,9 | 16,3 |
| 13.04.2024 | 69,2 | 15,4 |
| 12.04.2024 | 51,1 | 14,8 |
© Bayerisches Landesamt für Umwelt 2024