
- Startseite >
- Flüsse >
- Schwebstoff >
- Inn >
- Eschelbach >
- Jahresgrafik

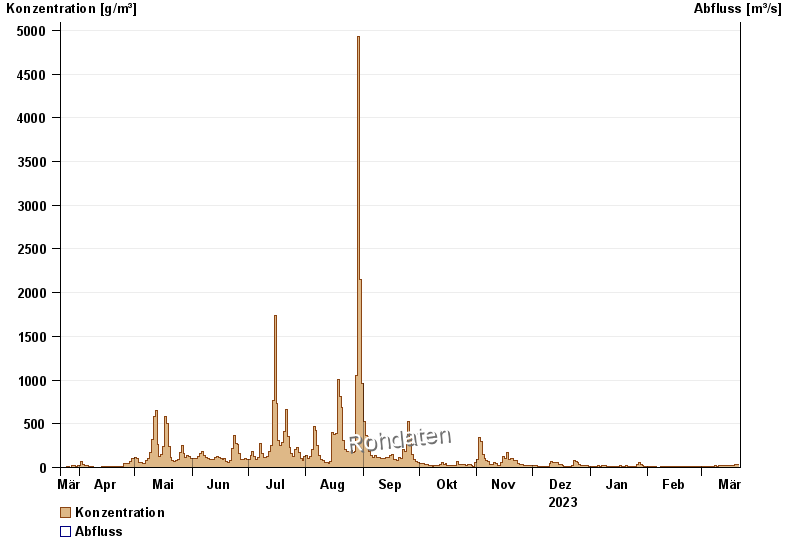
Jahresgrafik Eschelbach / Inn
Schwebstoff vom 22.03.2023 bis zum 21.03.2024
| Datum | Konzentration [g/m³] | Abfluss [m³/s] |
|---|---|---|
| 21.03.2024 | 32,1 | -- |
| 20.03.2024 | 33,1 | -- |
| 19.03.2024 | 29,7 | -- |
| 18.03.2024 | 26,4 | -- |
| 17.03.2024 | 20,1 | -- |
| 16.03.2024 | 19,1 | -- |
| 15.03.2024 | 23,9 | -- |
© Bayerisches Landesamt für Umwelt 2024