
- Startseite >
- Flüsse >
- Schwebstoff >
- Iller - Lech - Bodensee >
- Rosenheim o.d. Mangfallmündung >
- Jahresgrafik

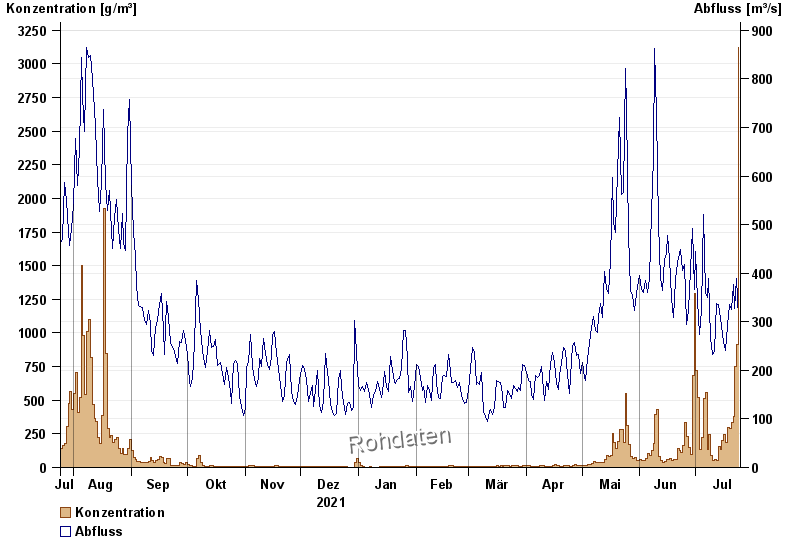
Jahresgrafik Rosenheim o.d. Mangfallmündung / Inn
Schwebstoff vom 25.07.2021 bis zum 24.07.2022
| Datum | Konzentration [g/m³] | Abfluss [m³/s] |
|---|---|---|
| 24.07.2022 | 3120,5 | 307 |
| 23.07.2022 | 917,7 | 389 |
| 22.07.2022 | 753,0 | 327 |
| 21.07.2022 | 379,9 | 376 |
| 20.07.2022 | 332,4 | 326 |
| 19.07.2022 | 288,2 | 335 |
| 18.07.2022 | 294,5 | 293 |
© Bayerisches Landesamt für Umwelt 2024