
- Startseite >
- Flüsse >
- Schwebstoff >
- Iller - Lech - Bodensee >
- Rosenheim o.d. Mangfallmündung >
- Jahresgrafik

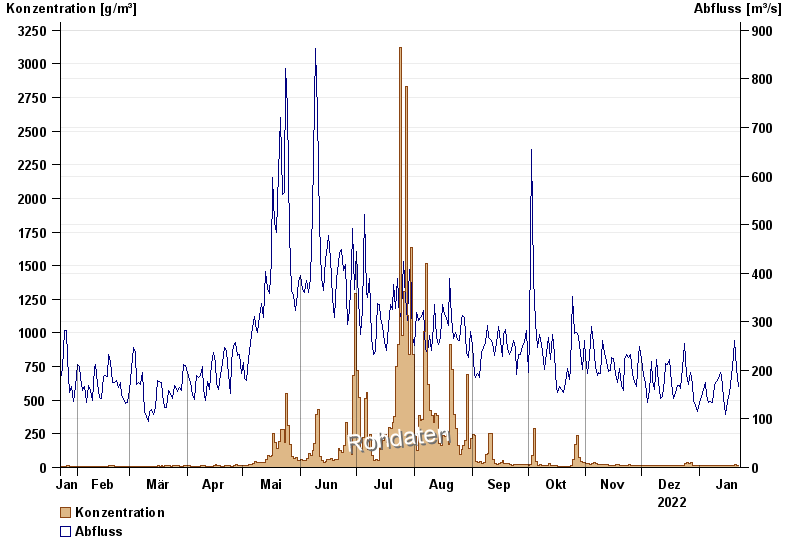
Jahresgrafik Rosenheim o.d. Mangfallmündung / Inn
Schwebstoff vom 23.01.2022 bis zum 22.01.2023
| Datum | Konzentration [g/m³] | Abfluss [m³/s] |
|---|---|---|
| 22.01.2023 | 15,3 | 166 |
| 21.01.2023 | 18,5 | 203 |
| 20.01.2023 | 18,8 | 262 |
| 19.01.2023 | 15,1 | 228 |
| 18.01.2023 | 12,6 | 190 |
| 17.01.2023 | 12,4 | 152 |
| 16.01.2023 | 13,4 | 135 |
© Bayerisches Landesamt für Umwelt 2024