
- Startseite >
- Flüsse >
- Schwebstoff >
- Iller - Lech - Bodensee >
- Rosenheim o.d. Mangfallmündung >
- Monatsgrafik

Monatsgrafik Rosenheim o.d. Mangfallmündung / Inn
Schwebstoff vom 10.08.2022 bis zum 09.09.2022
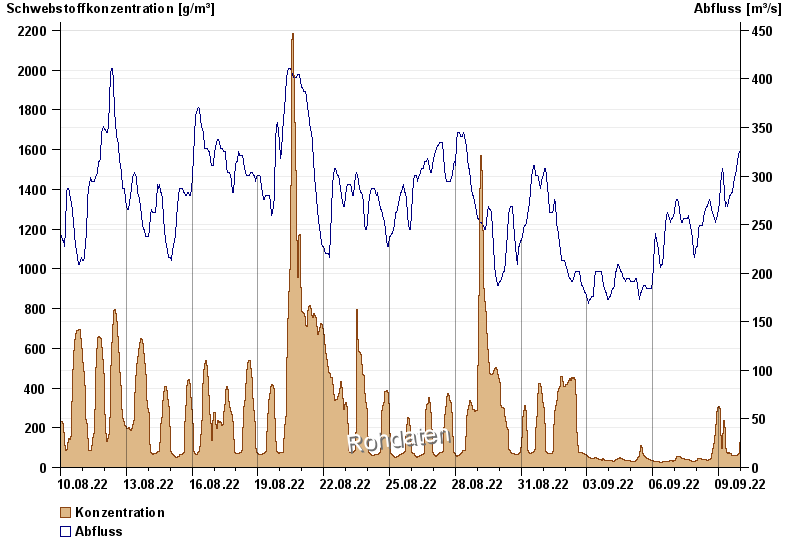
| Datum | Konzentration [g/m³] | Abfluss [m³/s] |
|---|---|---|
| 09.09.2022 23:45 | 342,1 | 318 |
| 09.09.2022 23:30 | 310,5 | 318 |
| 09.09.2022 23:15 | 265,5 | 321 |
| 09.09.2022 23:00 | 211,2 | 321 |
| 09.09.2022 22:45 | 171,2 | 325 |
| 09.09.2022 22:30 | 149,4 | 325 |
| 09.09.2022 22:15 | 124,7 | 325 |
© Bayerisches Landesamt für Umwelt 2024