
- Startseite >
- Flüsse >
- Schwebstoff >
- Iller - Lech - Bodensee >
- Rosenheim o.d. Mangfallmündung >
- Monatsgrafik

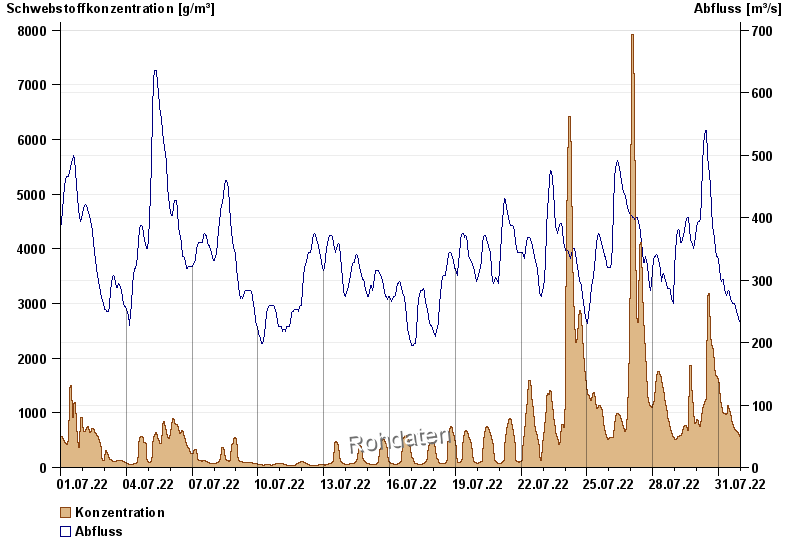
Monatsgrafik Rosenheim o.d. Mangfallmündung / Inn
Schwebstoff vom 01.07.2022 bis zum 31.07.2022
| Datum | Konzentration [g/m³] | Abfluss [m³/s] |
|---|---|---|
| 31.07.2022 23:45 | 496,1 | 230 |
| 31.07.2022 23:30 | 501,3 | 230 |
| 31.07.2022 23:15 | 508,5 | 230 |
| 31.07.2022 23:00 | 516,9 | 230 |
| 31.07.2022 22:45 | 524,9 | 230 |
| 31.07.2022 22:30 | 531,5 | 230 |
| 31.07.2022 22:15 | 541,7 | 230 |
© Bayerisches Landesamt für Umwelt 2024