
- Startseite >
- Flüsse >
- Schwebstoff >
- Iller - Lech - Bodensee >
- Kochel >
- Jahresgrafik

Jahresgrafik Kochel / Loisach
Schwebstoff vom 28.03.2024 bis zum 27.03.2025
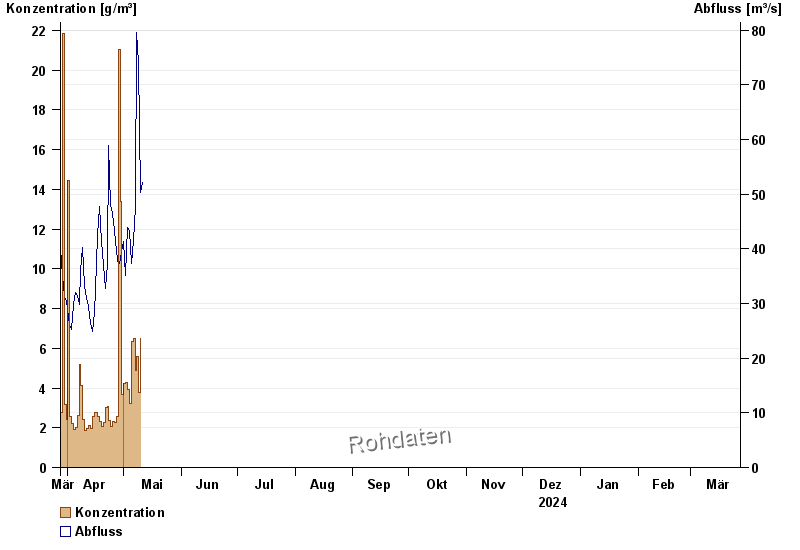
| Datum | Konzentration [g/m³] | Abfluss [m³/s] |
|---|---|---|
| 26.04.2024 | 2,3 | 43,3 |
| 25.04.2024 | 2,3 | 46,4 |
| 24.04.2024 | 2,1 | 48,1 |
| 23.04.2024 | 2,3 | 59 |
| 22.04.2024 | 3,1 | 37,2 |
| 21.04.2024 | 3,0 | 32,8 |
| 20.04.2024 | 2,2 | 37 |
© Bayerisches Landesamt für Umwelt 2024