
- Startseite >
- Flüsse >
- Schwebstoff >
- Iller - Lech - Bodensee >
- Eschelbach >
- Jahresgrafik

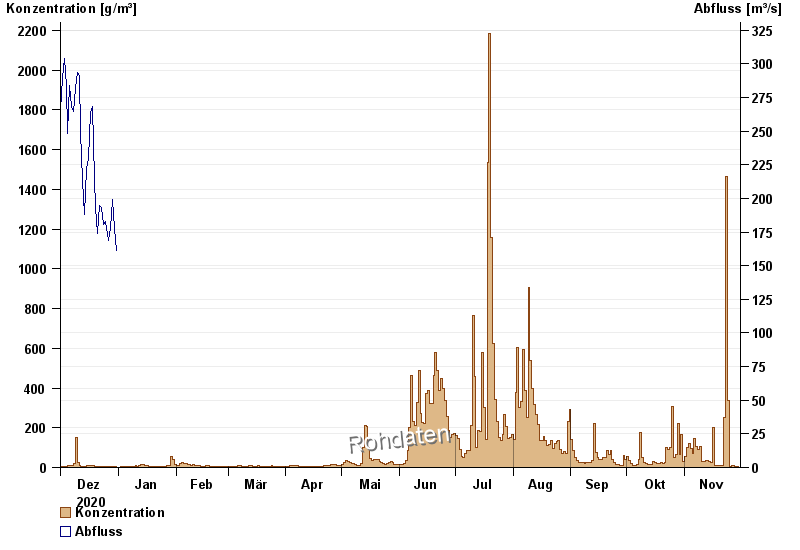
Jahresgrafik Eschelbach / Inn
Schwebstoff vom 01.12.2020 bis zum 30.11.2021
| Datum | Konzentration [g/m³] | Abfluss [m³/s] |
|---|---|---|
| 30.11.2021 | 6,6 | -- |
| 29.11.2021 | 6,6 | -- |
| 28.11.2021 | 7,3 | -- |
| 27.11.2021 | 7,7 | -- |
| 26.11.2021 | 8,5 | -- |
| 25.11.2021 | 5,8 | -- |
| 24.11.2021 | 337,6 | -- |
© Bayerisches Landesamt für Umwelt 2024