
- Startseite >
- Flüsse >
- Schwebstoff >
- Iller - Lech - Bodensee >
- Donauwörth >
- Jahresgrafik

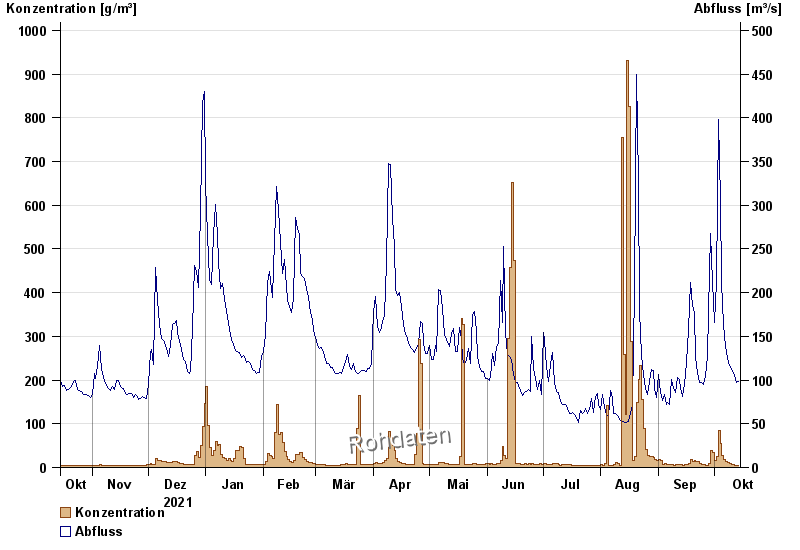
Jahresgrafik Donauwörth / Donau
Schwebstoff vom 15.10.2021 bis zum 14.10.2022
| Datum | Konzentration [g/m³] | Abfluss [m³/s] |
|---|---|---|
| 14.10.2022 | 0,2 | 98,7 |
| 13.10.2022 | 0,2 | 97,6 |
| 12.10.2022 | 0,2 | 105 |
| 11.10.2022 | 0,2 | 108 |
| 10.10.2022 | 0,2 | 113 |
| 09.10.2022 | 0,2 | 117 |
| 08.10.2022 | 0,2 | 125 |
© Bayerisches Landesamt für Umwelt 2024