
- Startseite >
- Flüsse >
- Schwebstoff >
- Bayern >
- Weilheim >
- Monatsgrafik

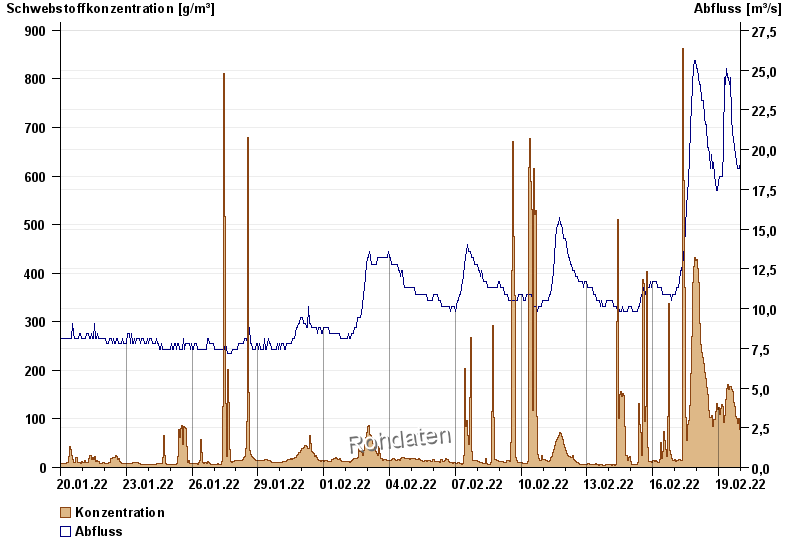
Monatsgrafik Weilheim / Ammer
Schwebstoff vom 20.01.2022 bis zum 19.02.2022
Beeinflussung
Moegliche Beeinflussung durch Bauarbeiten im oder am Gewaesser! Das Bauende ist offen.
| Datum | Konzentration [g/m³] | Abfluss [m³/s] |
|---|---|---|
| 19.02.2022 23:45 | 68,2 | 19,2 |
| 19.02.2022 23:30 | 73,1 | 18,3 |
| 19.02.2022 23:15 | 70,4 | 18,8 |
| 19.02.2022 23:00 | 74,7 | 18,3 |
| 19.02.2022 22:45 | 78,7 | 18,3 |
| 19.02.2022 22:30 | 72,5 | 18,3 |
| 19.02.2022 22:15 | 71,9 | 18,8 |
© Bayerisches Landesamt für Umwelt 2024