
- Startseite >
- Flüsse >
- Schwebstoff >
- Bayern >
- Weilheim >
- Jahresgrafik

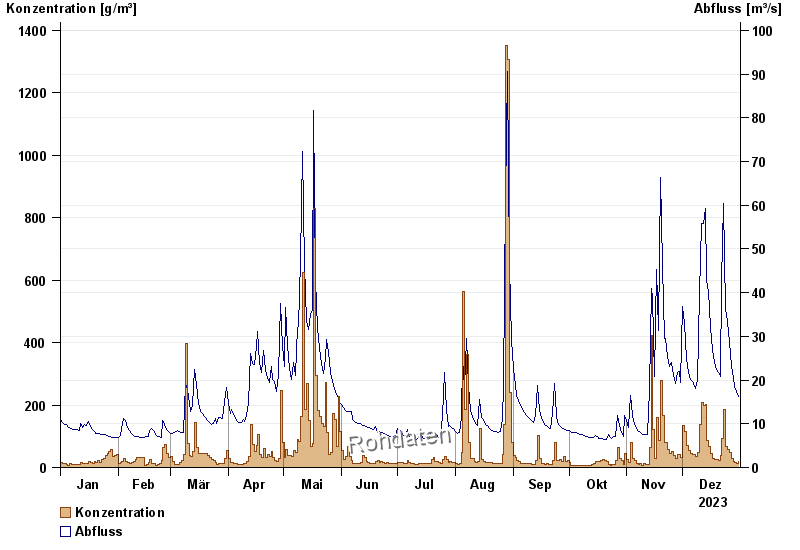
Jahresgrafik Weilheim / Ammer
Schwebstoff vom 01.01.2023 bis zum 31.12.2023
Beeinflussung
Moegliche Beeinflussung durch Bauarbeiten im oder am Gewaesser! Das Bauende ist offen.
| Datum | Konzentration [g/m³] | Abfluss [m³/s] |
|---|---|---|
| 31.12.2023 | 44,7 | 16,2 |
| 30.12.2023 | 13,8 | 17,3 |
| 29.12.2023 | 15,2 | 18,6 |
| 28.12.2023 | 17,9 | 20,4 |
| 27.12.2023 | 53,3 | 23,3 |
| 26.12.2023 | 103,4 | 28,6 |
| 25.12.2023 | 58,2 | 33,3 |
© Bayerisches Landesamt für Umwelt 2024