
- Startseite >
- Flüsse >
- Schwebstoff >
- Bayern >
- Staudach >
- Monatsgrafik

Monatsgrafik Staudach / Tiroler Achen
Schwebstoff vom 27.04.2024 bis zum 26.05.2024
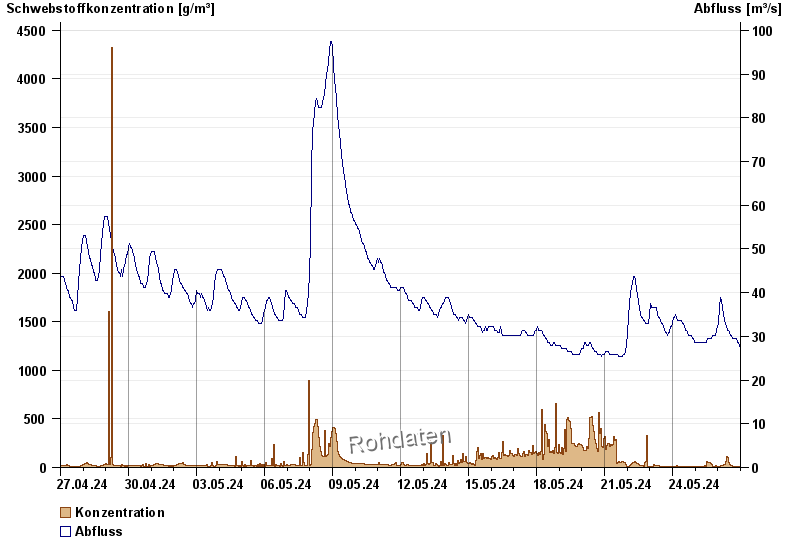
| Datum | Konzentration [g/m³] | Abfluss [m³/s] |
|---|---|---|
| 08.05.2024 23:45 | 407,8 | 91,8 |
| 08.05.2024 23:30 | 408,5 | 92,9 |
| 08.05.2024 23:15 | 407,5 | 93,9 |
| 08.05.2024 23:00 | 405,9 | 95,3 |
| 08.05.2024 22:45 | 397,5 | 96,3 |
| 08.05.2024 22:30 | 388,4 | 96,3 |
| 08.05.2024 22:15 | 373,5 | 96,3 |
© Bayerisches Landesamt für Umwelt 2024