
- Startseite >
- Flüsse >
- Schwebstoff >
- Bayern >
- Linden >
- Jahresgrafik

Jahresgrafik Linden / Rott
Schwebstoff vom 29.03.2024 bis zum 28.03.2025
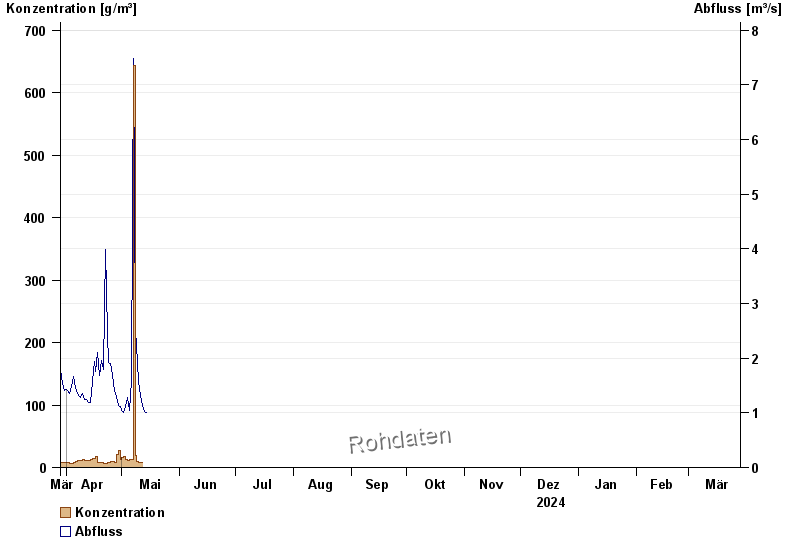
| Datum | Konzentration [g/m³] | Abfluss [m³/s] |
|---|---|---|
| 27.04.2024 | 8,4 | 1,41 |
| 26.04.2024 | 9,0 | 1,68 |
| 25.04.2024 | 9,0 | 1,91 |
| 24.04.2024 | 8,4 | 1,92 |
| 23.04.2024 | 8,3 | 2,45 |
| 22.04.2024 | 7,1 | 3,99 |
| 21.04.2024 | 6,2 | 1,8 |
© Bayerisches Landesamt für Umwelt 2024