
- Startseite >
- Flüsse >
- Schwebstoff >
- Bayern >
- Donauwörth >
- Jahresgrafik

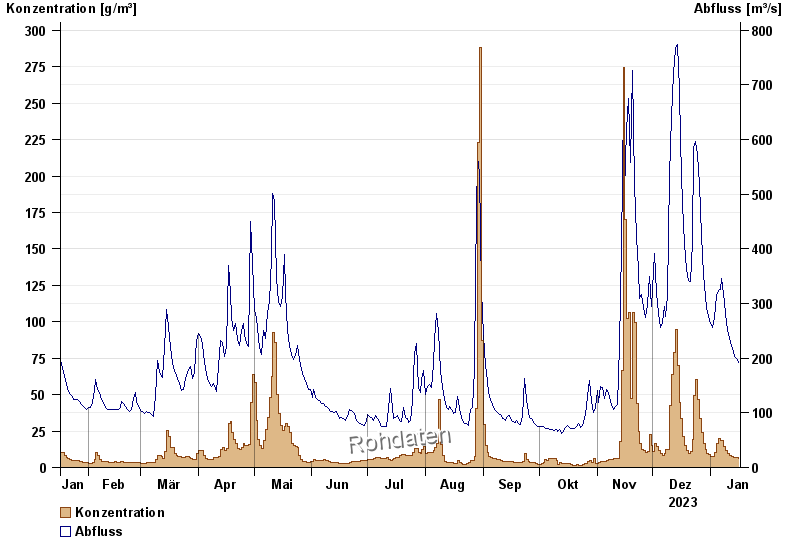
Jahresgrafik Donauwörth / Donau
Schwebstoff vom 17.01.2023 bis zum 16.01.2024
| Datum | Konzentration [g/m³] | Abfluss [m³/s] |
|---|---|---|
| 16.01.2024 | 6,2 | 193 |
| 15.01.2024 | 6,6 | 199 |
| 14.01.2024 | 6,9 | 204 |
| 13.01.2024 | 6,9 | 213 |
| 12.01.2024 | 7,5 | 223 |
| 11.01.2024 | 8,1 | 236 |
| 10.01.2024 | 9,3 | 250 |
© Bayerisches Landesamt für Umwelt 2024