
- Startseite >
- Flüsse >
- Chemie >
- Isar >
- oh. Mündung Kesselbach >
- Jahresgrafik

Jahresgrafik oh. Mündung Kesselbach / Zellbach
Daten vom 2011-01-01 bis zum 2011-12-31
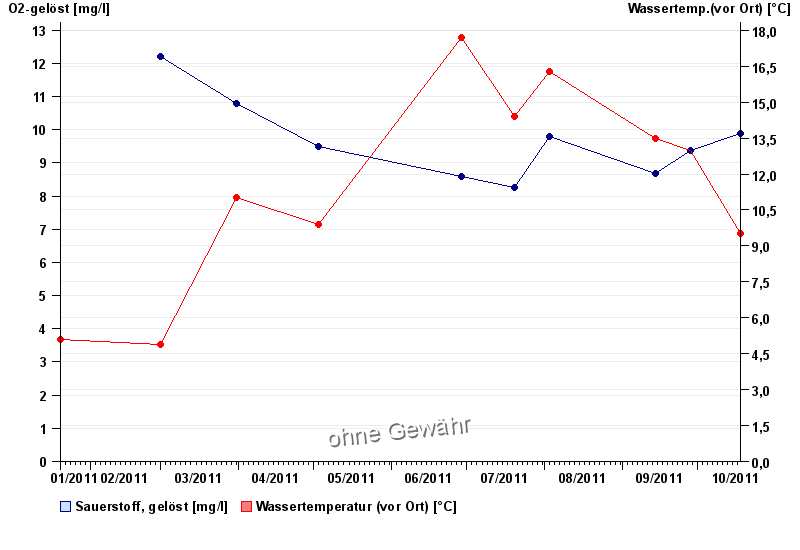
| Datum | O2-gelöst [mg/l] | Wassertemp.(vor Ort) [°C] |
|---|---|---|
| 18.10.2011 | 9,9 | 9,5 |
| 28.09.2011 | 9,37 | 13 |
| 14.09.2011 | 8,69 | 13,5 |
| 03.08.2011 | 9,8 | 16,3 |
| 20.07.2011 | 8,25 | 14,4 |
| 29.06.2011 | 8,58 | 17,7 |
| 03.05.2011 | 9,5 | 9,9 |
© Bayerisches Landesamt für Umwelt 2024