
- Startseite >
- Flüsse >
- Chemie >
- Oberer Main - Elbe >
- Rothwind, Mühlstau HMS 05 >
- Jahresgrafik

Jahresgrafik Rothwind, Mühlstau HMS 05 / Main
Daten vom 2017-12-14 bis zum 2018-12-13
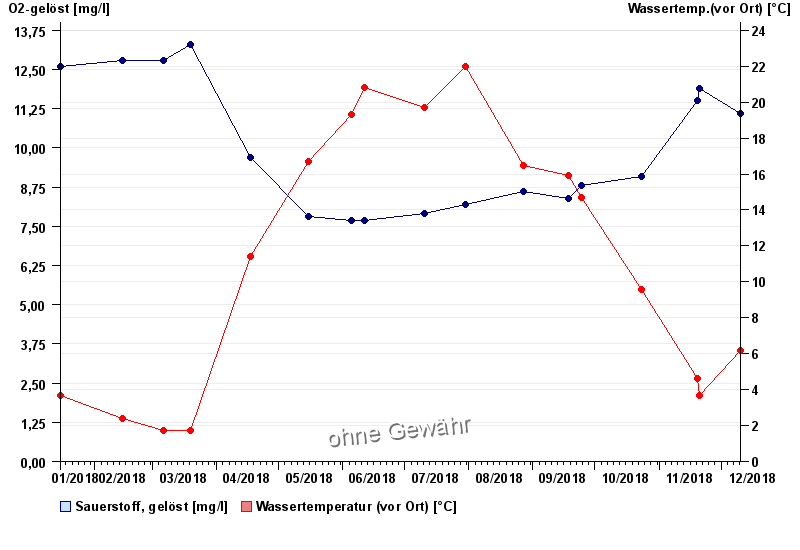
| Datum | O2-gelöst [mg/l] | Wassertemp.(vor Ort) [°C] |
|---|---|---|
| 10.12.2018 | 11,1 | 6,2 |
| 20.11.2018 | 11,9 | 3,7 |
| 19.11.2018 | 11,5 | 4,6 |
| 23.10.2018 | 9,1 | 9,6 |
| 24.09.2018 | 8,8 | 14,7 |
| 18.09.2018 | 8,4 | 15,9 |
| 27.08.2018 | 8,6 | 16,5 |
© Bayerisches Landesamt für Umwelt 2024