
- Startseite >
- Flüsse >
- Abfluss >
- Obere Donau >
- Seemannsmühle >
- Jahresgrafik

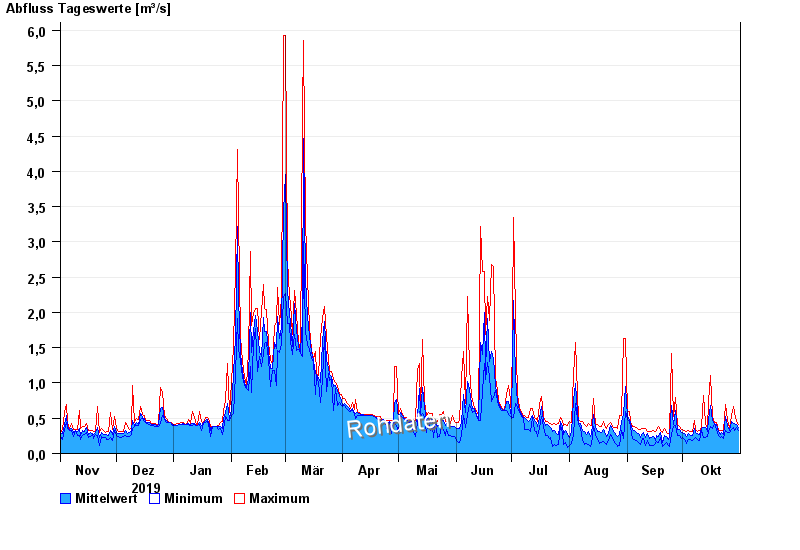
Jahresgrafik Seemannsmühle / Schwäbische Rezat
Abfluss vom 01.11.2019 bis zum 31.10.2020
| Datum | Mittelwert [m³/s] | Maximum [m³/s] | Minimum [m³/s] |
|---|---|---|---|
| 31.10.2020 | 0,37 | 0,418 | 0,327 |
| 30.10.2020 | 0,412 | 0,447 | 0,365 |
| 29.10.2020 | 0,428 | 0,585 | 0,327 |
| 28.10.2020 | 0,424 | 0,67 | 0,365 |
| 27.10.2020 | 0,459 | 0,537 | 0,34 |
| 26.10.2020 | 0,331 | 0,352 | 0,292 |
| 25.10.2020 | 0,396 | 0,462 | 0,292 |
© Bayerisches Landesamt für Umwelt 2024