
- Startseite >
- Flüsse >
- Abfluss >
- Obere Donau >
- Seemannsmühle >
- Jahresgrafik

Jahresgrafik Seemannsmühle / Schwäbische Rezat
Abfluss vom 01.01.2024 bis zum 20.04.2024
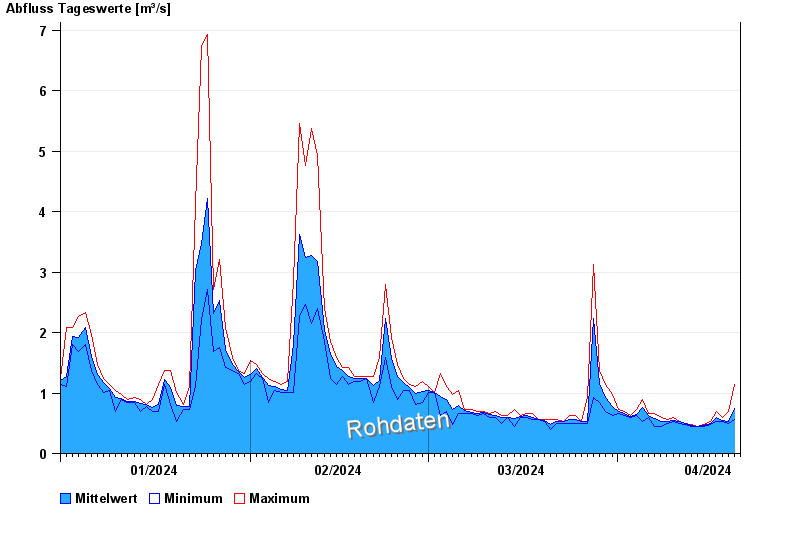
| Datum | Mittelwert [m³/s] | Maximum [m³/s] | Minimum [m³/s] |
|---|---|---|---|
| 20.04.2024 | 0,741 | 0,771 | 0,697 |
| 19.04.2024 | 0,526 | 0,697 | 0,503 |
| 18.04.2024 | 0,547 | 0,595 | 0,53 |
| 17.04.2024 | 0,588 | 0,697 | 0,53 |
| 16.04.2024 | 0,497 | 0,53 | 0,472 |
| 15.04.2024 | 0,469 | 0,472 | 0,444 |
| 14.04.2024 | 0,444 | 0,444 | 0,444 |
© Bayerisches Landesamt für Umwelt 2024