
- Startseite >
- Flüsse >
- Abfluss >
- Iller - Lech - Bodensee >
- Gschwend >
- Monatsgrafik

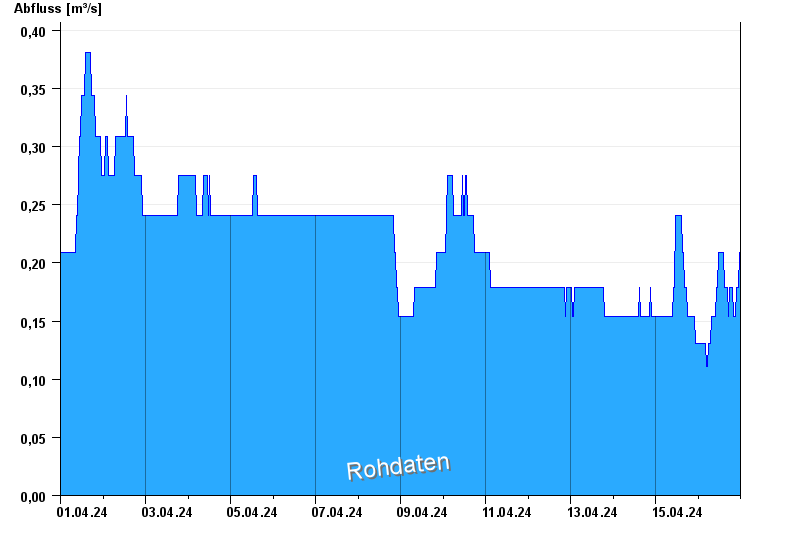
Monatsgrafik Gschwend / Rottach
Abfluss vom 01.04.2024 bis zum 16.04.2024
| Datum | Abfluss [m³/s] |
|---|---|
| 16.04.2024 07:30 | 0,154 |
| 16.04.2024 07:15 | 0,131 |
| 16.04.2024 07:00 | 0,131 |
| 16.04.2024 06:45 | 0,131 |
| 16.04.2024 06:30 | 0,131 |
| 16.04.2024 06:15 | 0,131 |
| 16.04.2024 06:00 | 0,131 |
© Bayerisches Landesamt für Umwelt 2024