
- Startseite >
- Flüsse >
- Abfluss >
- Iller - Lech - Bodensee >
- Gruben >
- Jahresgrafik

Jahresgrafik Gruben / Oybach
Abfluss vom 01.01.2021 bis zum 31.12.2021
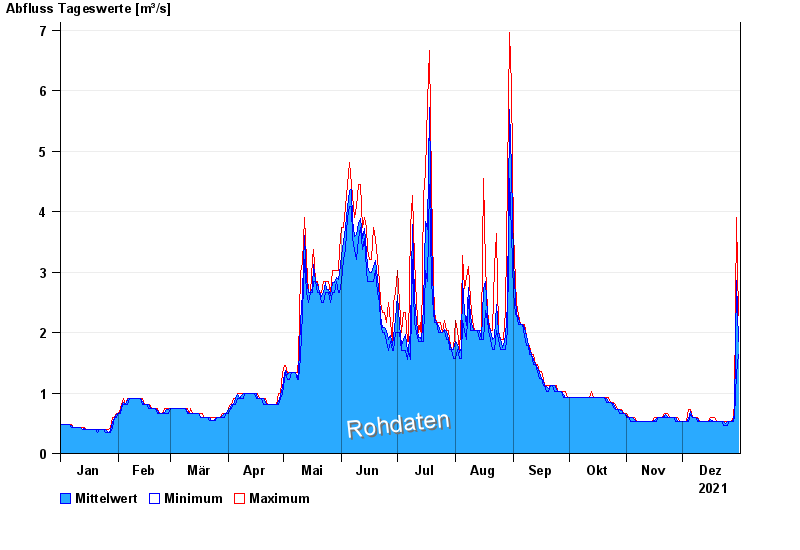
Abflusswerte unsicher
Beeinflussung durch Baumaßnahme
| Datum | Mittelwert [m³/s] | Maximum [m³/s] | Minimum [m³/s] |
|---|---|---|---|
| 31.12.2021 | 1,86 | 2,29 | 1,63 |
| 30.12.2021 | 2,86 | 3,91 | 1,33 |
| 29.12.2021 | 0,698 | 0,861 | 0,601 |
| 28.12.2021 | 0,542 | 0,601 | 0,532 |
| 27.12.2021 | 0,532 | 0,532 | 0,532 |
| 26.12.2021 | 0,532 | 0,532 | 0,532 |
| 25.12.2021 | 0,522 | 0,532 | 0,471 |
© Bayerisches Landesamt für Umwelt 2024