
- Startseite >
- Flüsse >
- Abfluss >
- Iller - Lech - Bodensee >
- Greifenmühle >
- Jahresgrafik

Jahresgrafik Greifenmühle / Rottach
Abfluss vom 01.01.2024 bis zum 19.04.2024
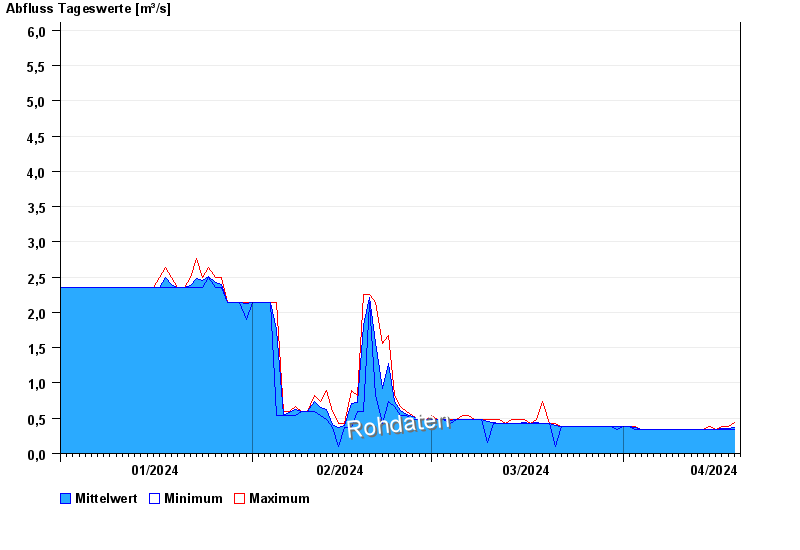
- HQ100 15 m³/s
| Datum | Mittelwert [m³/s] | Maximum [m³/s] | Minimum [m³/s] |
|---|---|---|---|
| 19.04.2024 | 0,341 | 0,389 | 0,339 |
| 18.04.2024 | 0,356 | 0,389 | 0,339 |
| 17.04.2024 | 0,359 | 0,389 | 0,339 |
| 16.04.2024 | 0,339 | 0,339 | 0,339 |
| 15.04.2024 | 0,349 | 1,02 | 0,339 |
| 14.04.2024 | 0,339 | 0,339 | 0,339 |
| 13.04.2024 | 0,339 | 0,339 | 0,339 |
© Bayerisches Landesamt für Umwelt 2024