
- Startseite >
- Flüsse >
- Abfluss >
- Iller - Lech - Bodensee >
- Görisried >
- Jahresgrafik

Jahresgrafik Görisried / Waldbach
Abfluss vom 22.09.2018 bis zum 21.09.2019
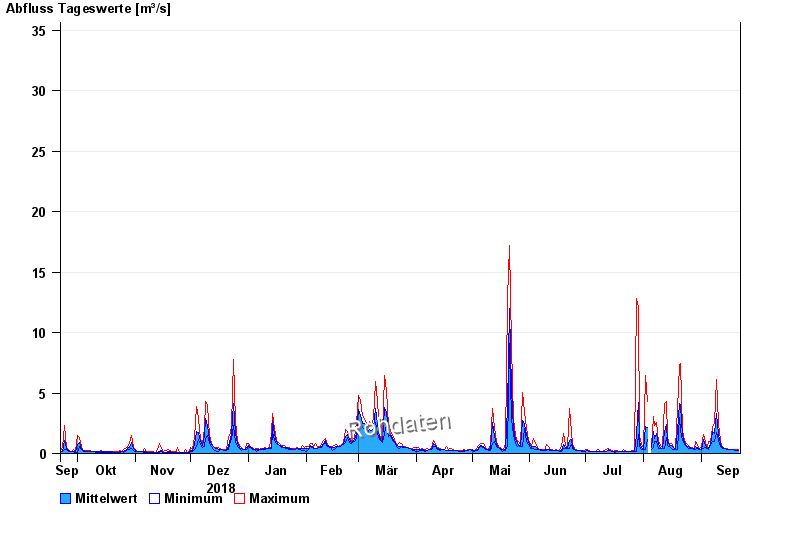
- HQ100 45 m³/s
| Datum | Mittelwert [m³/s] | Maximum [m³/s] | Minimum [m³/s] |
|---|---|---|---|
| 21.09.2019 | 0,272 | 0,291 | 0,262 |
| 20.09.2019 | 0,28 | 0,291 | 0,262 |
| 19.09.2019 | 0,283 | 0,291 | 0,262 |
| 18.09.2019 | 0,293 | 0,322 | 0,291 |
| 17.09.2019 | 0,322 | 0,322 | 0,322 |
| 16.09.2019 | 0,34 | 0,355 | 0,322 |
| 15.09.2019 | 0,368 | 0,389 | 0,355 |
© Bayerisches Landesamt für Umwelt 2024