
- Startseite >
- Flüsse >
- Abfluss >
- Iller - Lech - Bodensee >
- Görisried >
- Jahresgrafik

Jahresgrafik Görisried / Waldbach
Abfluss vom 21.09.2021 bis zum 20.09.2022
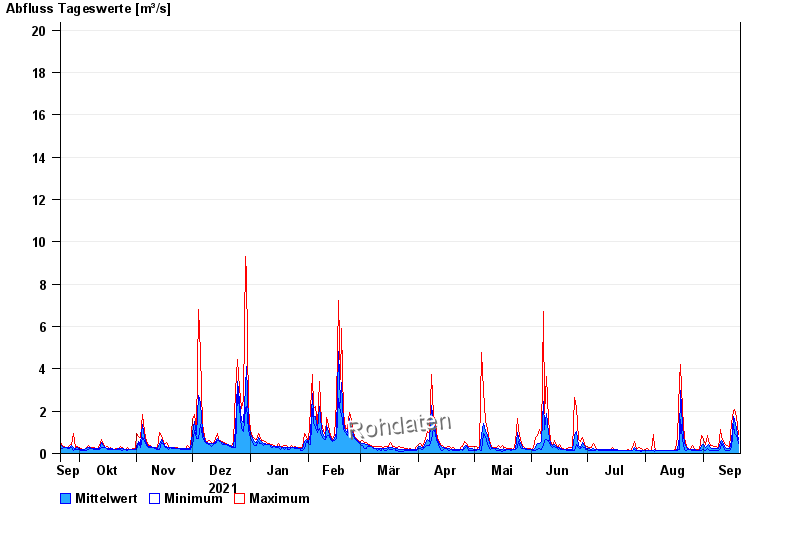
- HQ100 45 m³/s
| Datum | Mittelwert [m³/s] | Maximum [m³/s] | Minimum [m³/s] |
|---|---|---|---|
| 20.09.2022 | 0,649 | 0,9 | 0,492 |
| 19.09.2022 | 1,16 | 1,74 | 0,843 |
| 18.09.2022 | 1,6 | 2,07 | 0,962 |
| 17.09.2022 | 1,77 | 1,99 | 1,36 |
| 16.09.2022 | 0,572 | 1,43 | 0,26 |
| 15.09.2022 | 0,244 | 0,329 | 0,153 |
| 14.09.2022 | 0,237 | 0,367 | 0,134 |
© Bayerisches Landesamt für Umwelt 2024