
- Startseite >
- Flüsse >
- Abfluss >
- Iller - Lech - Bodensee >
- Fischach >
- Jahresgrafik

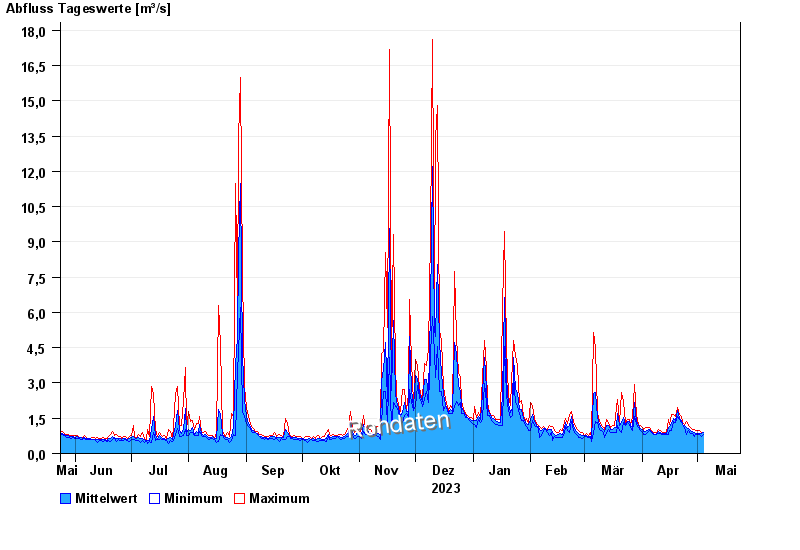
Jahresgrafik Fischach / Schmutter
Abfluss vom 24.05.2023 bis zum 23.05.2024
| Datum | Mittelwert [m³/s] | Maximum [m³/s] | Minimum [m³/s] |
|---|---|---|---|
| 23.04.2024 | 1,26 | 1,3 | 1,23 |
| 22.04.2024 | 1,42 | 1,59 | 1,3 |
| 21.04.2024 | 1,49 | 1,66 | 1,44 |
| 20.04.2024 | 1,83 | 1,96 | 1,59 |
| 19.04.2024 | 1,42 | 1,59 | 1,3 |
| 18.04.2024 | 1,48 | 1,66 | 1,37 |
| 17.04.2024 | 1,29 | 1,66 | 0,971 |
© Bayerisches Landesamt für Umwelt 2024